Free Excel Client Project Profitability Tracker Template
If you bill clients per project, the invoice total only tells half the story. A $20,000 project that eats 300 hours of labor and a stack of unbilled expenses can quietly lose money while a smaller $8,000 project comes in comfortably ahead - and without a side-by-side view of revenue against cost, most agencies and consultants only find out which is which at tax time.
This free Excel template is built for agency owners, consultants, and freelancers who invoice clients in milestones or fixed fees and want to know, project by project and client by client, what is actually profitable - not just what was billed.
The Client Project Profitability Tracker logs every invoice and every labor or expense cost against the project it belongs to, then automatically calculates profit, profit margin %, and a profitability ranking on a single dashboard, so you can spot the projects and clients worth repeating and the ones that need a price increase or a hard look at scope.
Key Features
- Separate Project Revenue and Project Costs logs, so billed amounts and delivery costs never get mixed.
- Automatic profit and profit margin % calculation for every project, using straightforward, auditable formulas
- Configurable Healthy/Watch/Loss margin bands with colour-coded conditional formatting
- A “Client (Auto)” lookup on both Revenue and Costs, so the client is always the one assigned to that project on Settings - no mismatched names
- Project and client profitability rankings, including automatic Most Profitable and Least Profitable Project KPIs
- A Total Profit YTD KPI driven by an editable As-of Date
- Dropdown lists for Project, Client, Cost Type, and Status - no free-typed category values
- Real Excel Tables with banded rows and frozen headers on both data-entry sheets
What You Can Track
- Client invoices and revenue milestones, with date, description, and amount
- Labor and expense costs against each project, with cost type and notes
- Which projects are completed vs. In Progress
- Total revenue, labor cost, expense cost, total cost, profit, and margin % per project
- Total revenue, total cost, profit, margin %, and project count per client
- Year-to-date profit across all projects, as of any date you choose
Dashboard & Reports
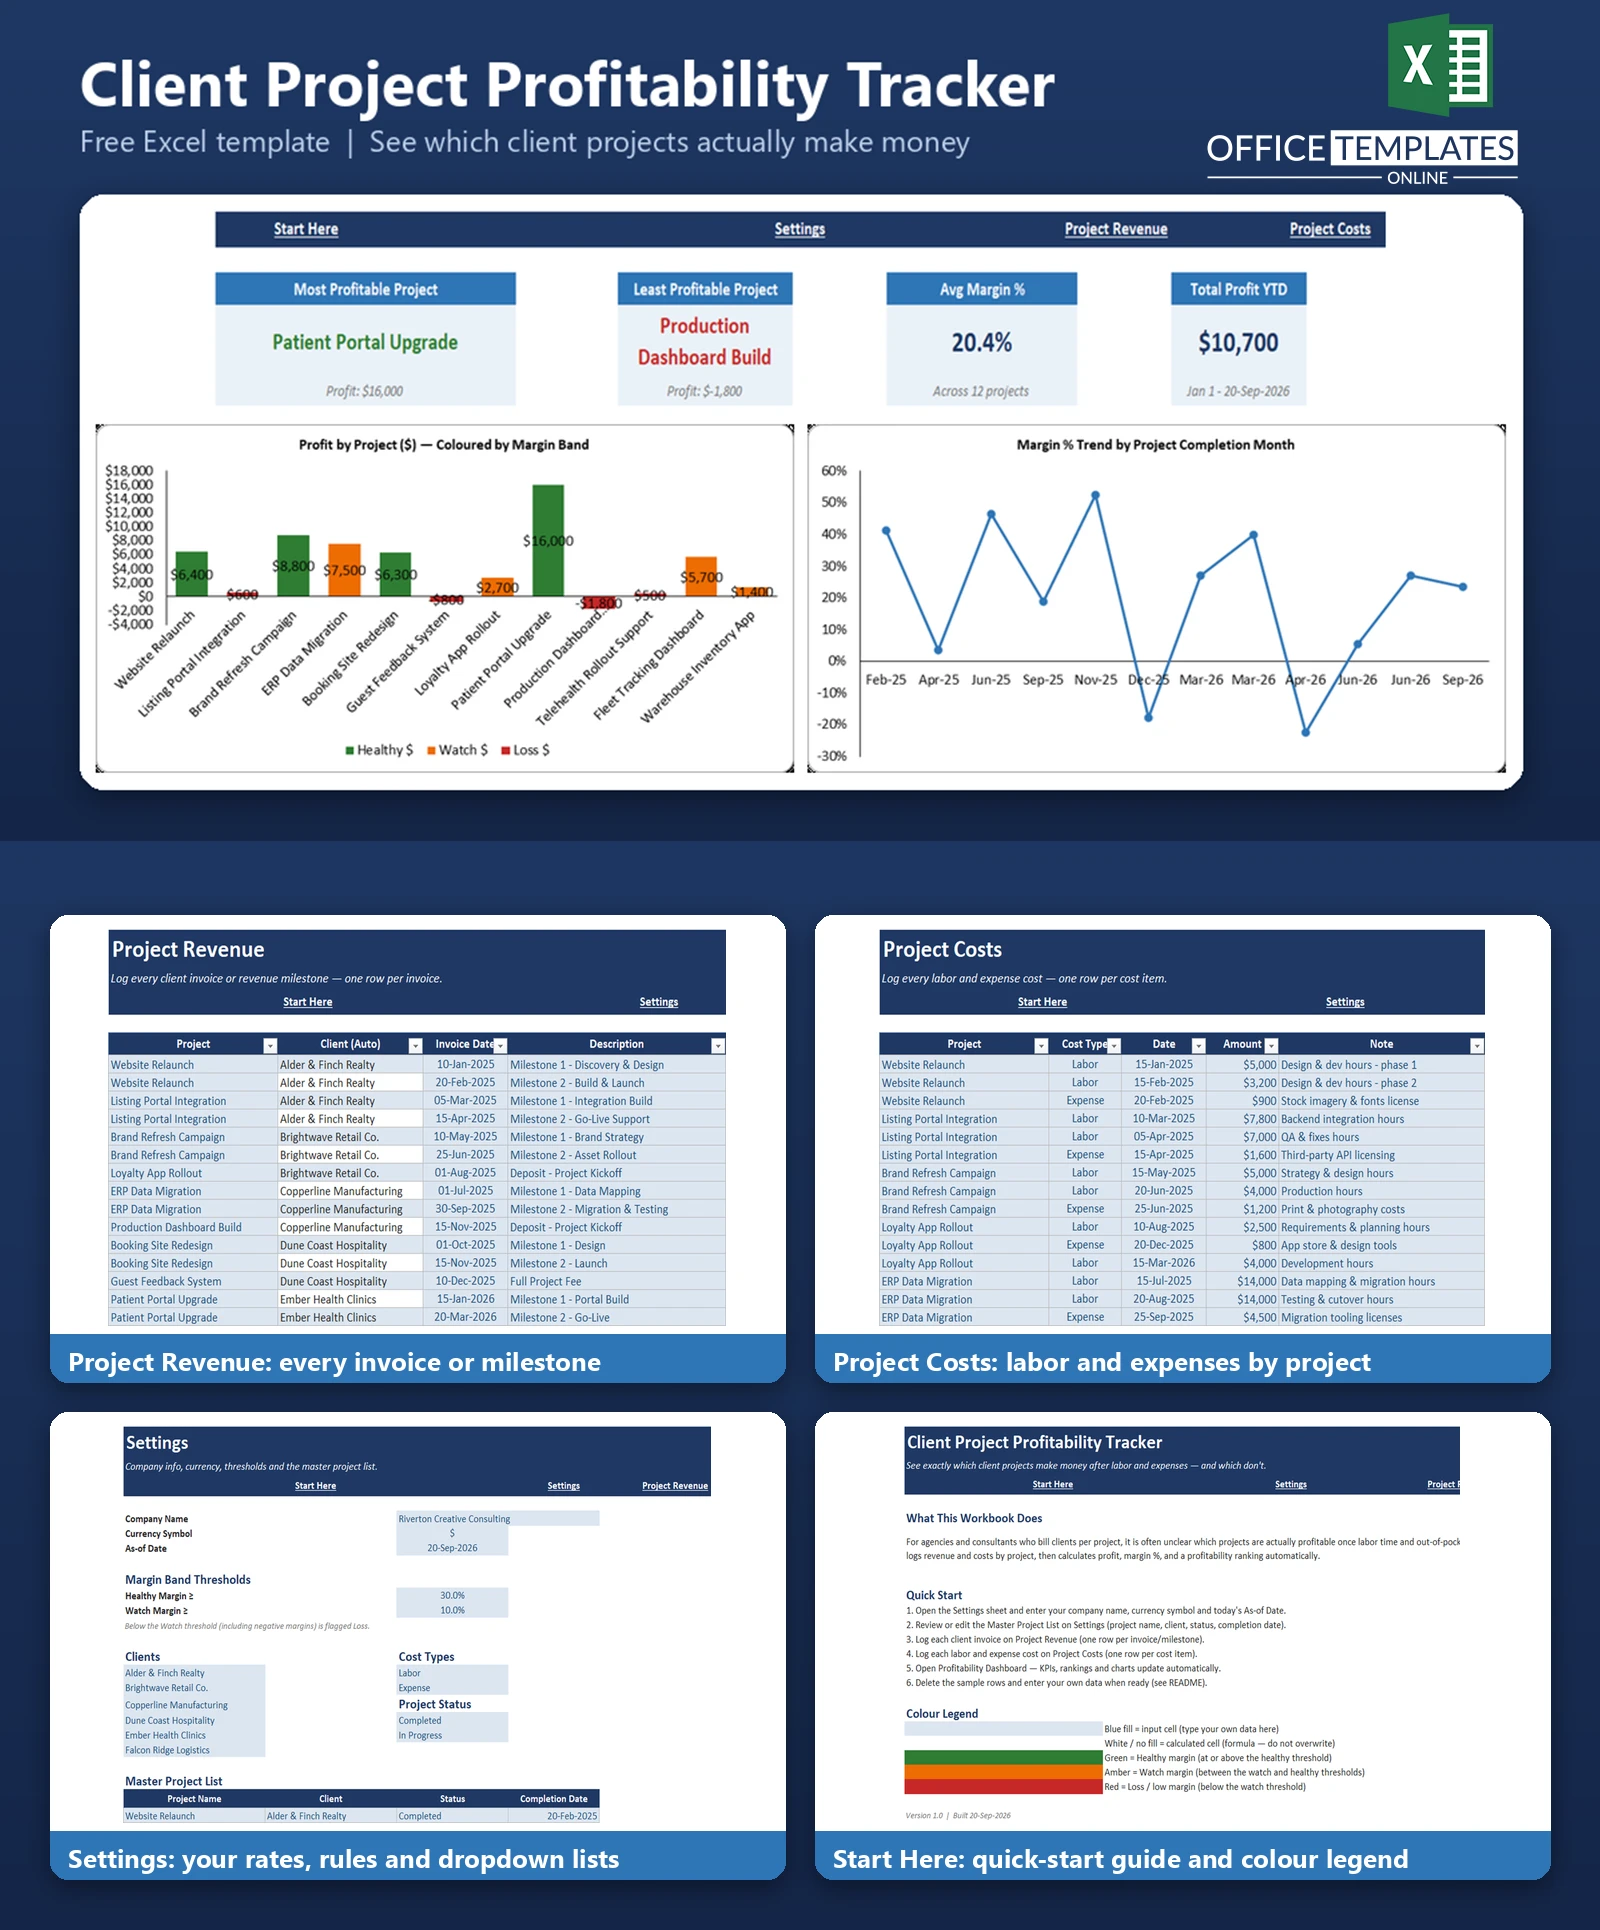
The Profitability Dashboard sheet brings everything together in one place: a KPI strip showing the Most Profitable Project, Least Profitable Project, Average Margin %, and Total Profit YTD; a full Project Profitability Summary table with a profit rank and a colour-coded Healthy/Watch/Loss band for every project; a Profit by Project bar chart that is colour-coded by margin band; a Margin % Trend line chart that plots every project in the order it was completed, so you can see whether profitability is trending up or down over time; and a Client Profitability Summary table that ranks your clients from most to least profitable.
Who Is This Template For
- Marketing, design, and creative agencies that bill clients per project or per milestone
- Consultants and freelancers who invoice in fixed fees or project-based deposits
- Small professional-services firms deciding which clients or project types to keep taking on
- Anyone who currently tracks invoices in one place and costs in another (or not at all) and wants a single profitability view
How to Use the Template
- Open the Settings sheet and enter your company name, currency symbol, and today’s As-of Date.
- Review the Master Project List on Settings: each row is a project with its client, status, and completion date.
- Log every client invoice on the Project Revenue sheet - one row per invoice or milestone.
- Log every labor and expense cost on the Project Costs sheet - one row per cost item.
- Open the Profitability Dashboard. The KPIs, rankings, and both charts update automatically.
- Delete the sample data and enter your own projects, invoices, and costs when you’re ready.
Benefits
- See real profit and margin per project instead of relying on invoice totals alone.
- Catch a project heading toward a loss while it is still in progress
- Identify which clients are consistently low-margin so you can re-price or renegotiate scope
- Rank projects and clients by profitability without building a single formula yourself
- Keep a clear, sortable record you can review with partners or use at year-end
Excel Requirements
This template contains no macros. It uses standard Excel formulas (SUMIFS, INDEX, MATCH, IF, IFERROR, RANK, COUNTIFS, TEXT) that work in any modern desktop version of Excel, including Excel 2016, 2019, 2021, and Microsoft 365. A desktop version of Excel is recommended so the charts, dropdown lists, and conditional formatting colours render correctly; Excel Online and other spreadsheet apps may display fonts or chart styling slightly differently.
Frequently Asked Questions
Does this template calculate profit automatically, or do I have to enter it myself?
Profit and margin % are calculated automatically. You only enter revenue (on Project Revenue) and costs (on Project Costs); the Profitability Dashboard sums both by project and by client and calculates profit, margin %, and rank for you.
Can I track more than the 12 sample projects or 6 sample clients?
Yes. The Master Project List on Settings has room for up to 40 projects (12 sample rows plus 28 blank styled rows). The Project Revenue and Project Costs tables have dropdown and formula capacity for 500 rows each. Adding more clients than the 6 sample clients requires extending the Clients list on Settings and the Client Profitability Summary table on the dashboard.
What counts as a “Loss” project?
Any project whose margin % falls below the “Watch Margin ?” threshold on Settings (10% by default) is flagged as a Loss, including projects with a negative margin. You can change the Healthy and Watch thresholds on Settings at any time, and every colour and ranking on the dashboard recalculates automatically.
How is the client shown on the Revenue and Costs sheets kept consistent?
Both sheets include a “Client (Auto)” column that looks up the client assigned to the selected project on the Settings Master Project List, so the same project can never accidentally get billed or costed under two different client names.
What does the Margin % Trend chart actually show?
It plots the margin % of every project in the order the projects were completed (earliest to most recent), not by calendar month, so each point represents one project. This makes it easy to see whether your profitability is improving or declining over time as you take on new work.
Does this replace my accounting or time-tracking software?
No. This is a lightweight profitability tracker for revenue and cost totals you already know (from invoices, timesheets, or expense reports). It is not connected to any accounting or time-tracking system and does not generate invoices.
Is there a limit to how many years of data I can keep in one workbook?
There is no hard year limit, but the sample formulas size their lookup ranges to 500 rows on Project Revenue and Project Costs. If you track a very high volume of invoices or cost entries over many years, extend those ranges or start a new workbook per year.
Will this work on Mac or older versions of Excel?
Yes. It uses only standard, long-established Excel functions and contains no macros, so it works on Excel for Mac and any modern desktop Windows version of Excel.

← Previous Article
Free Excel Project Budget Tracker Template with Cost Overrun AlertsYou may also like