Free Excel Project Budget Tracker Template with Cost Overrun Alerts
Most agencies and contractors budget a project before it starts, then lose track of how spending compares to that budget until the invoices catch up with them - usually after the project is already over. By the time a monthly report shows a category running hot, the money is already spent.
This free Excel Project Budget & Cost Tracker template gives you a simple place to enter each project's budget by cost category, log actual costs as they happen, and see - automatically - which projects are on track, which are approaching their budget threshold, and which have already gone over. It also forecasts where each project is headed based on its current spending pace, so a project that looks fine today but is trending toward an overrun gets flagged before it becomes a surprise.
Everything runs on formulas built into a standard .xlsx workbook - no macros, no add-ins, no subscription. Enter your projects and costs, and the dashboard, status flags, and charts update on their own.
Key Features
- Track unlimited projects, each broken into cost categories (Labor, Materials, Software, Travel, Contractors, Equipment, or your own).
- Automatic Variance ($) and % of Budget Consumed at both the whole-project level and the project-by-category level.
- Four-state Status flag - ON TRACK, NEAR THRESHOLD, AT RISK (TRENDING OVER), OVER BUDGET - color-coded and consistent across every sheet.
- Forecast at Completion for every project, based on actual spend and how much of the project's planned timeline has elapsed.
- An adjustable over-budget threshold percentage that drives every status flag from one Settings cell.
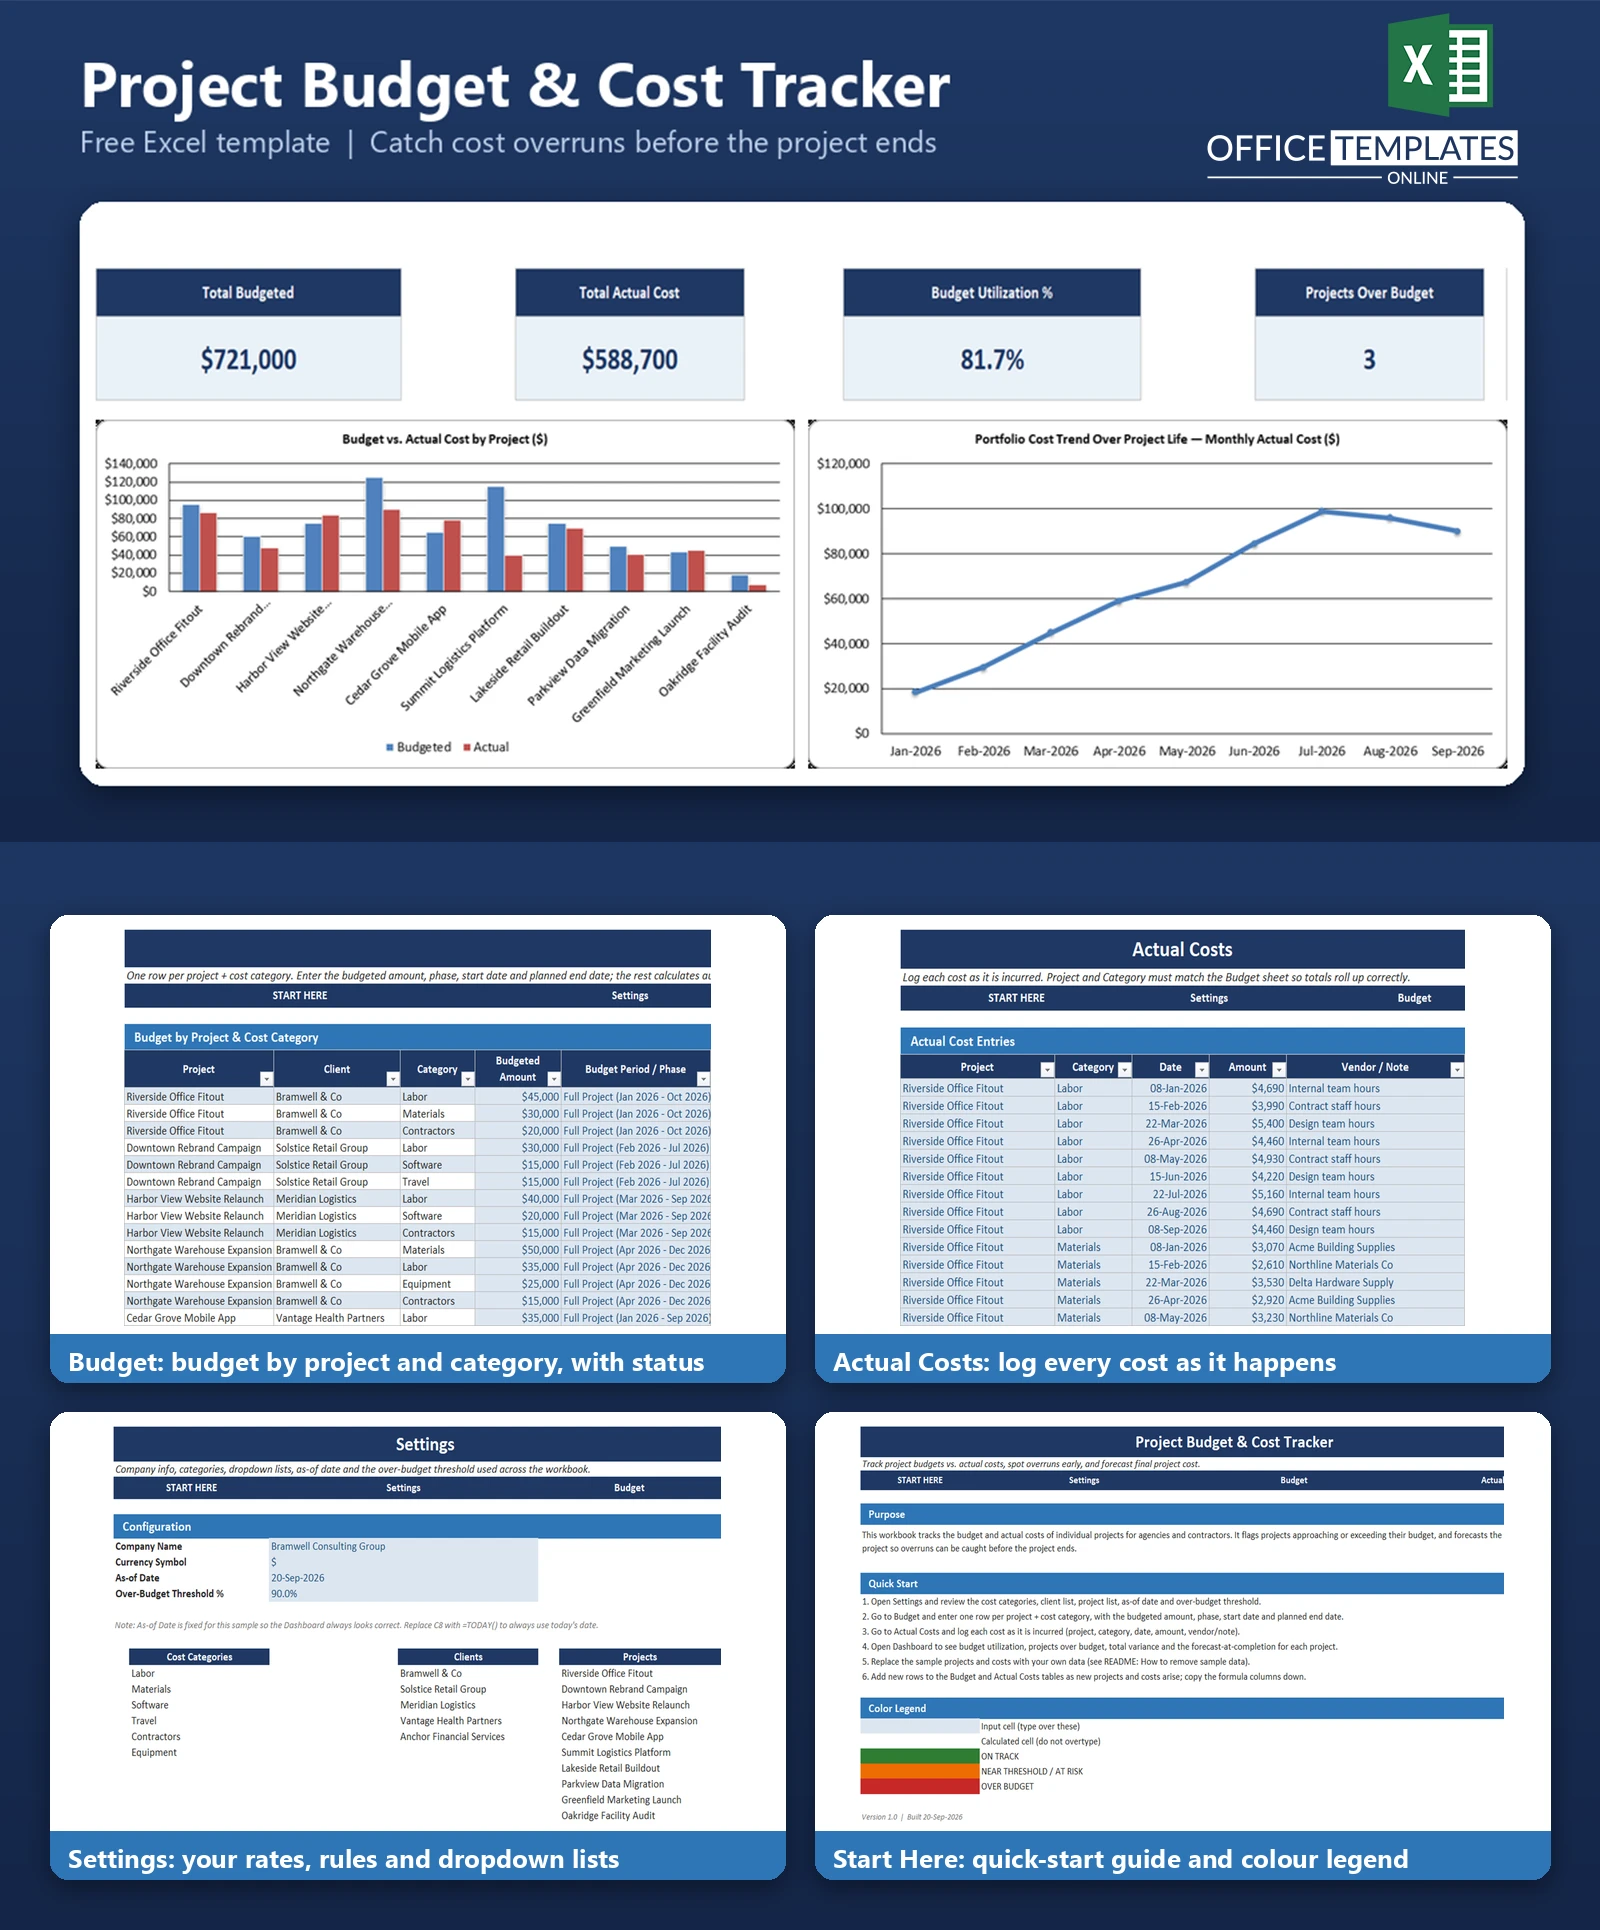
- Dashboard KPI strip: Total Budgeted, Total Actual Cost, Budget Utilization %, Projects Over Budget, and Total Variance.
- Two charts: Budget vs. Actual Cost by Project, and a monthly Portfolio Cost Trend line across the project timeline.
- Dropdown lists for Project, Client, and Category keep every entry consistent - no typos splitting a project's costs into two rows.
- Ten fictional sample projects with realistic monthly cost entries, already set up to show on-track, near-threshold, and over-budget examples.
What You Can Track
- Budgeted amount per project, per cost category, per phase or period.
- Actual costs as they're incurred - date, amount, vendor, or note- tied to a project and category.
- Variance in dollars and as a percentage of budget, at the category level and rolled up to the whole project.
- Elapsed % of each project's planned timeline, based on its start date, planned end date, and a workbook-wide as-of date.
- Forecast at Completion - where each project's total cost is heading if current spending continues at its current pace.
- How many projects are currently over budget, and the combined dollar variance across the whole portfolio.
Dashboard & Reports
The Dashboard sheet opens with a five-card KPI strip - Total Budgeted, Total Actual Cost, Budget Utilization %, Projects Over Budget, and Total Variance - so the portfolio-level picture is visible before you look at a single project.
Below the KPIs, a clustered bar chart compares Budgeted and Actual cost side by side for every project, making it immediately obvious which projects are running hot. A line chart tracks total actual cost across the portfolio month by month, showing the overall spending trend over the project timeline.
A Project Summary table lists every project with its budget, actual cost, variance, % consumed, elapsed time, forecast at completion, and status - the same calculations used for the charts, in a sortable table you can scan project by project.
Who Is This Template For
- Agencies and consultancies that budget and bill work on a per-project basis.
- Contractors managing multiple concurrent jobs, each with its own budget.
- Project managers or operations leads who need an early warning before a project goes over budget, not a postmortem after it does.
- Small teams that don't have (or don't want) a dedicated project-accounting system, and are comfortable working in Excel.
How to Use the Template
- Open the Settings sheet and review the company name, currency symbol, as-of date, and over-budget threshold.
- Update the Cost Categories, Clients, and Projects lists on Settings so the dropdowns match your business.
- On the Budget sheet, add one row per project and cost category with its budgeted amount, phase, start date, and planned end date.
- On the Actual Costs sheet, log each cost as it happens - project, category, date, amount, and vendor/note.
- Open the Dashboard to see budget utilization, which projects are flagged, and the forecast for each one.
- Add new rows to the Budget and Actual Costs tables as new projects and costs come in - the tables expand and the dashboard updates automatically.
Benefits
- See a project's cost overrun risk while there is still time to act on it, instead of finding out at project close.
- One consistent view across every project, instead of a separate spreadsheet - or no spreadsheet - per project.
- The over-budget threshold is adjustable in one place, so you can tune how early the warning triggers.
- Works entirely in standard Excel - no macros, no plugins, nothing to install or enable.
- Fully editable formulas, so you can see exactly how every number and flag is calculated and adjust the logic if your business needs something different.
Excel Requirements
This template is a standard .xlsx workbook with no macros. It works in Excel 2016 or later, Excel 365 for desktop, and Excel Online, using only formulas that have been available since Excel 2007 (SUMIFS, AVERAGEIFS, COUNTIF, INDEX, MATCH, IF, IFERROR, TEXT, EOMONTH). No add-ins or extra permissions are required.
Frequently Asked Questions
Does this template track revenue or profit, not just cost?
No. This template is cost/budget-only - it tracks what each project was budgeted to cost and what it actually cost, with no revenue, billing, or margin fields. If you need to compare project revenue against cost to see profitability, use a dedicated client project profitability template instead.
How does the Forecast at Completion actually work?
It's a run-rate calculation: Actual Cost to Date divided by the project's Elapsed % of its planned timeline (time elapsed between the project's start date and planned end date, as of the workbook's as-of date). If a project has spent 60% of its final expected cost after only 40% of its timeline has elapsed, the forecast projects that pace forward to the full timeline. Once a project's timeline is complete, the forecast simply equals its actual cost to date.
What does the AT RISK (TRENDING OVER) status mean, and how is it different from NEAR THRESHOLD?
NEAR THRESHOLD means the project's current % of budget consumed has already reached your over-budget threshold (90% by default). AT RISK (TRENDING OVER) is the earlier warning: current spend is still comfortably below the threshold, but the Forecast at Completion already exceeds the budgeted amount - meaning the pace of spending, if it continues, will land the project over budget by the time it finishes.
Can I change the over-budget threshold percentage?
Yes. It's a single input cell on the Settings sheet, and every status flag in the workbook - on the Budget sheet and on the Dashboard - references that one cell.
How many projects can the template handle?
The Budget and Actual Costs tables are sized generously (through row 500) and will expand automatically as you add rows. The Dashboard's Project Summary table ships pre-built for the 10 sample projects; add rows there (and extend the two chart ranges) if you track more.
Does the template use TODAY() so the dashboard is always current?
The sample workbook uses a fixed As-of Date (20-Sep-2026) on the Settings sheet so the sample dashboard and sample data always line up correctly no matter when you open the file. You can replace that cell with =TODAY() if you'd rather have Elapsed %, Forecast, and Status move forward automatically with the calendar.
Is there a macro I need to enable?
No. The workbook has no macros of any kind - it's a plain .xlsx file, so there's no security warning to dismiss and nothing to enable.
Can I remove the sample data and start fresh?
Yes. Delete the sample rows on the Budget and Actual Costs sheets, replace the Cost Categories, Clients, and Projects lists on Settings with your own, and enter your projects. Full steps are in the included README.