Free Excel Budget vs Actual Dashboard Template
Most small businesses set a budget once a year and then lose track of it the moment real spending starts. Bank statements, receipts, and invoices pile up in different places, and by the time anyone compares actual spend to plan, the month - or quarter - is already over and the overspend has already happened.
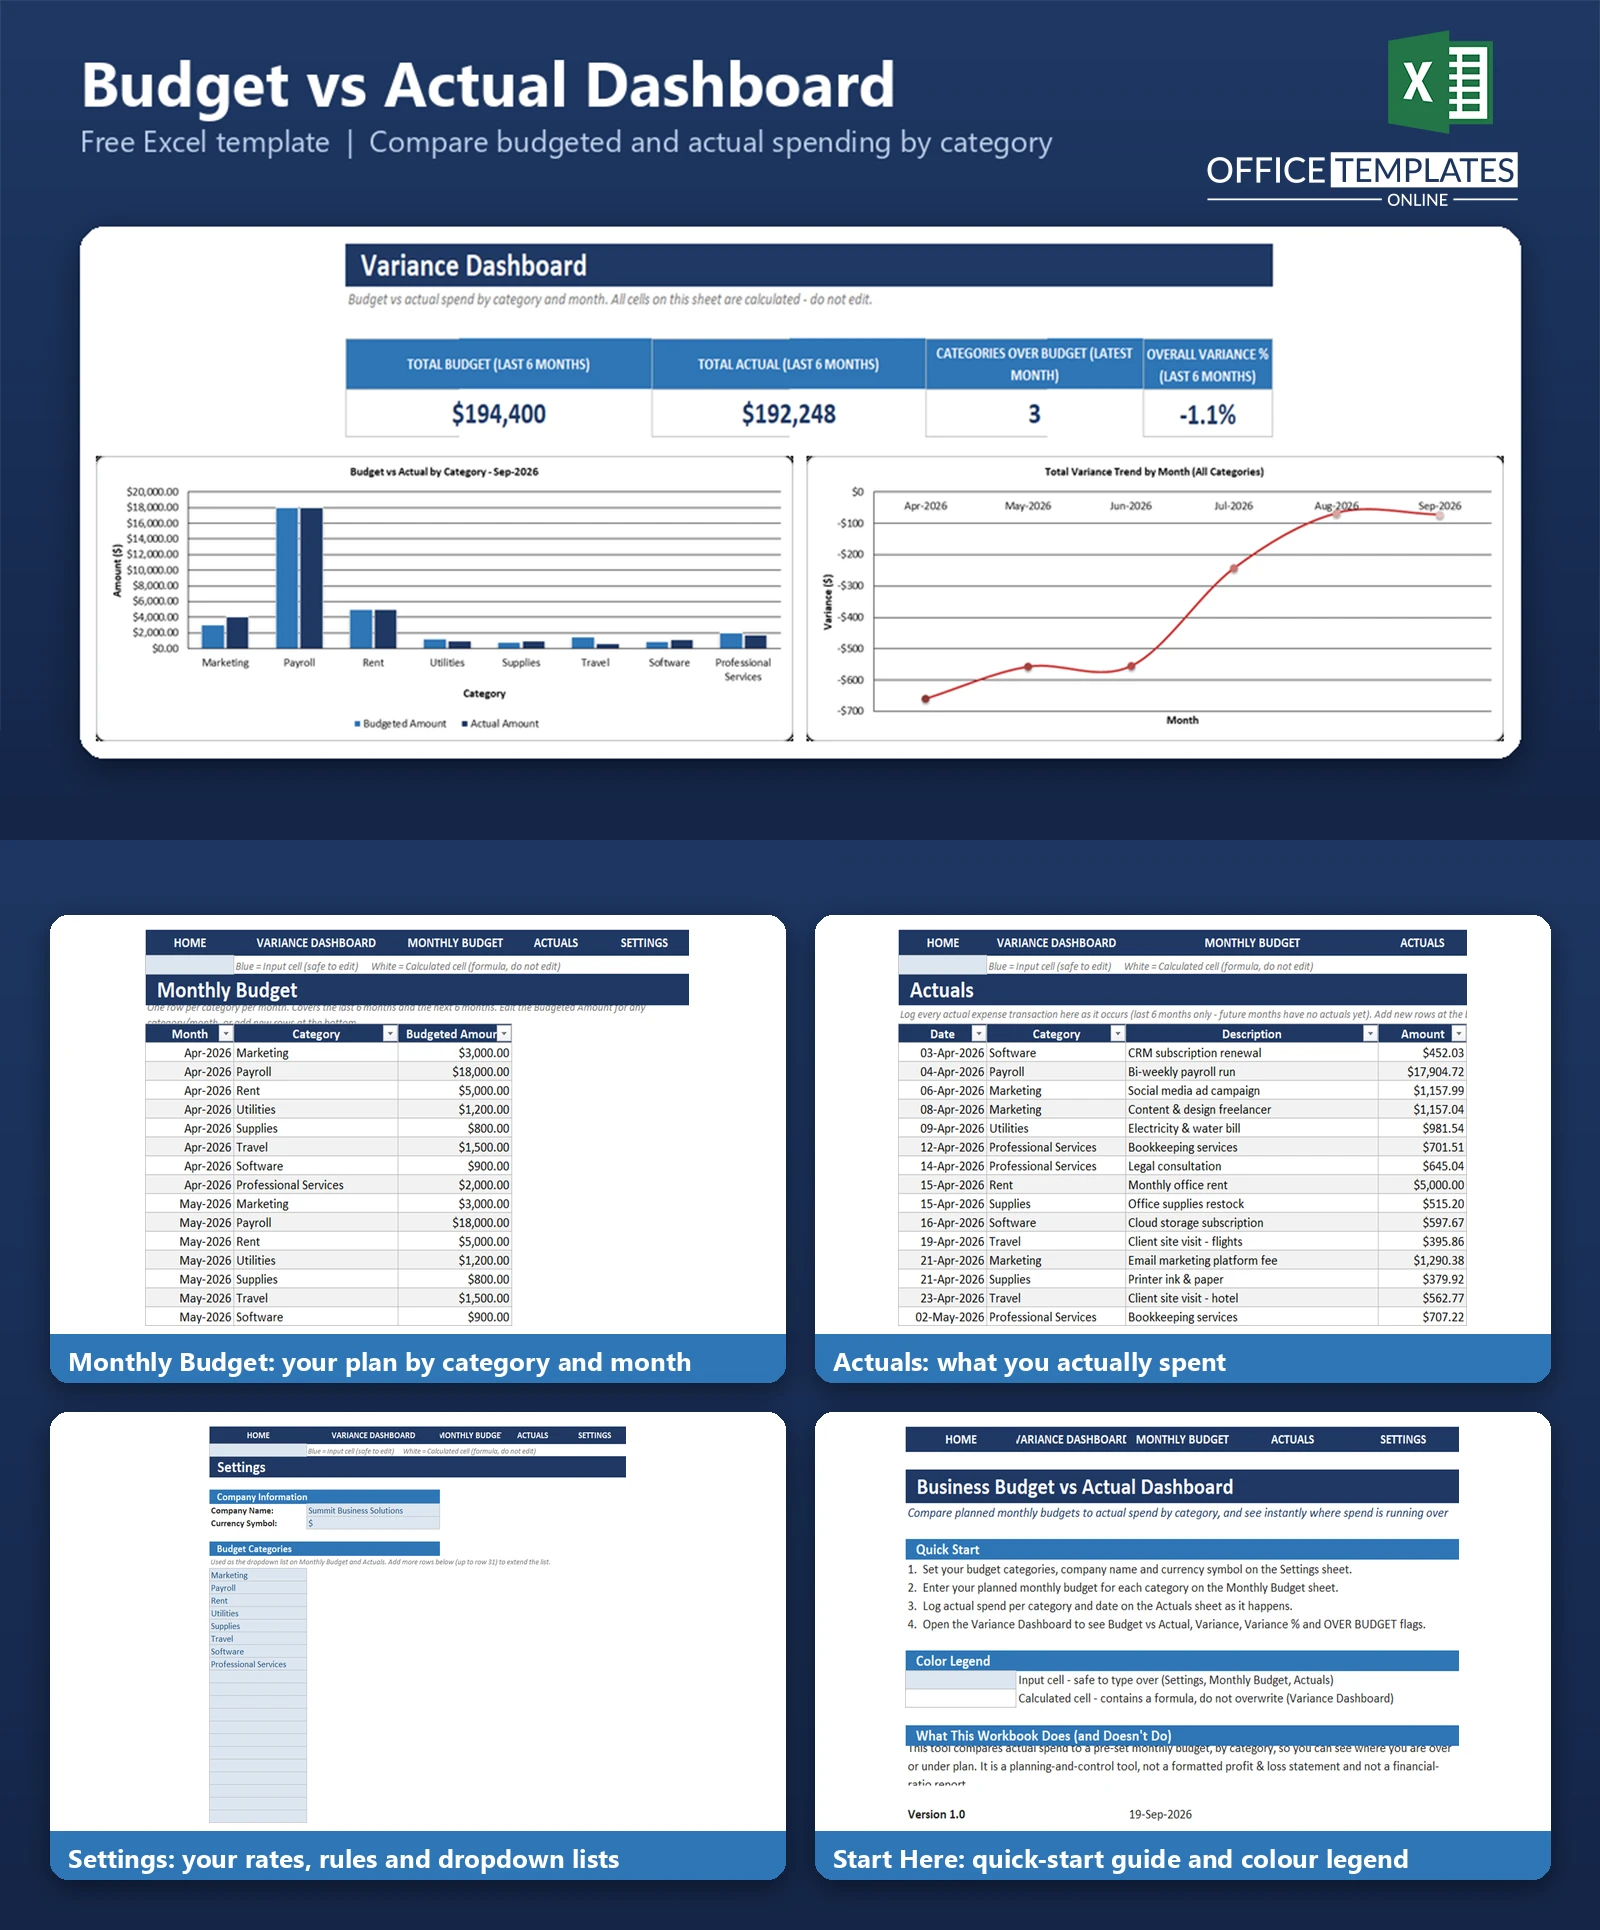
The Business Budget vs Actual Dashboard is a free Excel template built to close that gap. You set a monthly budget per spending category, log actual expenses as they happen, and the workbook automatically calculates the variance, the variance percentage, and flags any category that has gone OVER BUDGET - all without formulas to write or software to learn.
It's a planning-and-control workbook, not a full accounting system: it won't generate a profit & loss statement or financial ratios, but it will tell you, at a glance, exactly which categories are running hot and by how much.
Key Features
- Rolling 12-month Monthly Budget table (last 6 months + next 6 months) with a category dropdown
- Actuals log for individual expense transactions, with date, category, description, and amount.
- Automatic Budget vs Actual vs Variance vs Variance % calculation for every category and month
- OVER BUDGET / OK status flag with red/green conditional formatting
- KPI cards for Total Budget, Total Actual, Categories Over Budget, and Overall Variance %
- Budget vs Actual chart by category for the latest month, plus a variance-trend line chart
- Editable category list, company name, and currency symbol on a dedicated Settings sheet
- Clean navy-and-white design with a clear blue = input/white = calculated cell convention
- Click-through navigation bar on every sheet - no scrolling or tab-hunting required
What You Can Track
- Planned monthly budget for each spending category (marketing, payroll, rent, utilities, supplies, travel, software, professional services, or your own categories)
- Every actual expense transaction, with date, category, short description, and amount
- Variance in dollars and as a percentage of budget, for every category/month combination
- Which categories are currently over budget, and by how much
- How total spend is trending month over month against total budget
Dashboard & Reports
The Variance Dashboard sheet is the heart of the workbook. At the top, four KPI cards summarize the tracked period: Total Budget, Total Actual, how many categories are currently over budget, and the overall variance percentage.
Below the KPIs sits a detailed Budget vs Actual table with one row per category per month, showing Budgeted Amount, Actual Amount, Variance, Variance %, and a Status column that reads OVER BUDGET or OK. Two charts round out the sheet: a clustered bar chart comparing budget to actual for every category in the latest month, and a line chart tracking total variance across all tracked months.
Who Is This Template For
Business owners, department heads, and managers who set a monthly spending plan by category and want a simple, reliable way to check actual spend against it - without needing accounting software or a finance team to build the report for them. It suits small businesses, agencies, nonprofits, and any team that budgets by category month to month.
How to Use the Template
- Set up Settings
Enter your company name, currency symbol, and the list of budget categories you want to track.
- Enter your monthly budget.
On the Monthly Budget sheet, enter the amount you plan to spend for each category, each month.
- Log actual spending
On the Actuals sheet, record each expense as it happens - date, category, description, amount.
- Review the dashboard
Open the Variance Dashboard to see budget vs actual, variances, and which categories need attention.
Benefits
- See budget overruns while there's still time to act, instead of after the month closes.
- No manual variance math - every calculation updates automatically as you add data
- One file to maintain instead of scattered spreadsheets, notes, or bank statement printouts
- Works entirely offline in Excel - no subscription, login, or add-in required
- Easy to extend - add categories, months, or transaction rows any time
Excel Requirements
Built for modern desktop Excel (Microsoft 365, Excel 2016-2021/2024). No macros or VBA are used - every calculation is a standard formula (SUMIFS, IFERROR, TEXT, EDATE), so the file opens safely with macros disabled and works the same way on Windows or Mac Excel.
Frequently Asked Questions
Do I need Excel experience to use this template?
No. You only need to type values into clearly marked blue input cells - the categories are chosen from a dropdown, and every calculation on the dashboard happens automatically.
Can I add more budget categories than the eight included?
Yes. The category list on the Settings sheet has room for up to 20 categories, and both the Monthly Budget and Actuals tables can have new rows added at any time.
How does the template decide if a category is OVER BUDGET?
A category is flagged OVER BUDGET when its actual spend exceeds its budgeted amount by more than 1%, which avoids flagging categories that land essentially on target. Anything at or under budget (or within that 1% tolerance) shows as OK.
Does this template replace accounting software?
No. It's a budget-vs-actual tracking and control tool for category-level spend discipline, not a bookkeeping system, profit & loss statement, or financial-ratio report.
Can I change the currency symbol?
Yes, on the Settings sheet. Note that the symbol used in the number formatting of amount cells is set when the workbook is built, so if you switch currencies, you may also want to update the number format on the amount columns to match.
What time period does the template cover?
It ships with a 12-month rolling window - six months back and six months forward from the current month - so you can plan while tracking recent actuals. You can extend the Monthly Budget table with more rows as time passes.
Is there sample data included?
Yes, so you can see how the dashboard behaves before entering your own numbers. Sample budget and actual data are easy to find and delete - see the README for step-by-step instructions.
Will this work in Excel for Mac or Excel Online?
It's built and tested in desktop Excel, using only broadly compatible formulas and features (no macros, no functions newer than the Excel 2007 era), so it should behave the same way in Excel for Mac. Full chart and conditional-formatting fidelity in Excel Online is not guaranteed.

← Previous Article
Free Excel Accounts Payable Template for Tracking Bills and Due DatesYou may also like