Free Excel Profit and Loss Template with Margin Dashboard
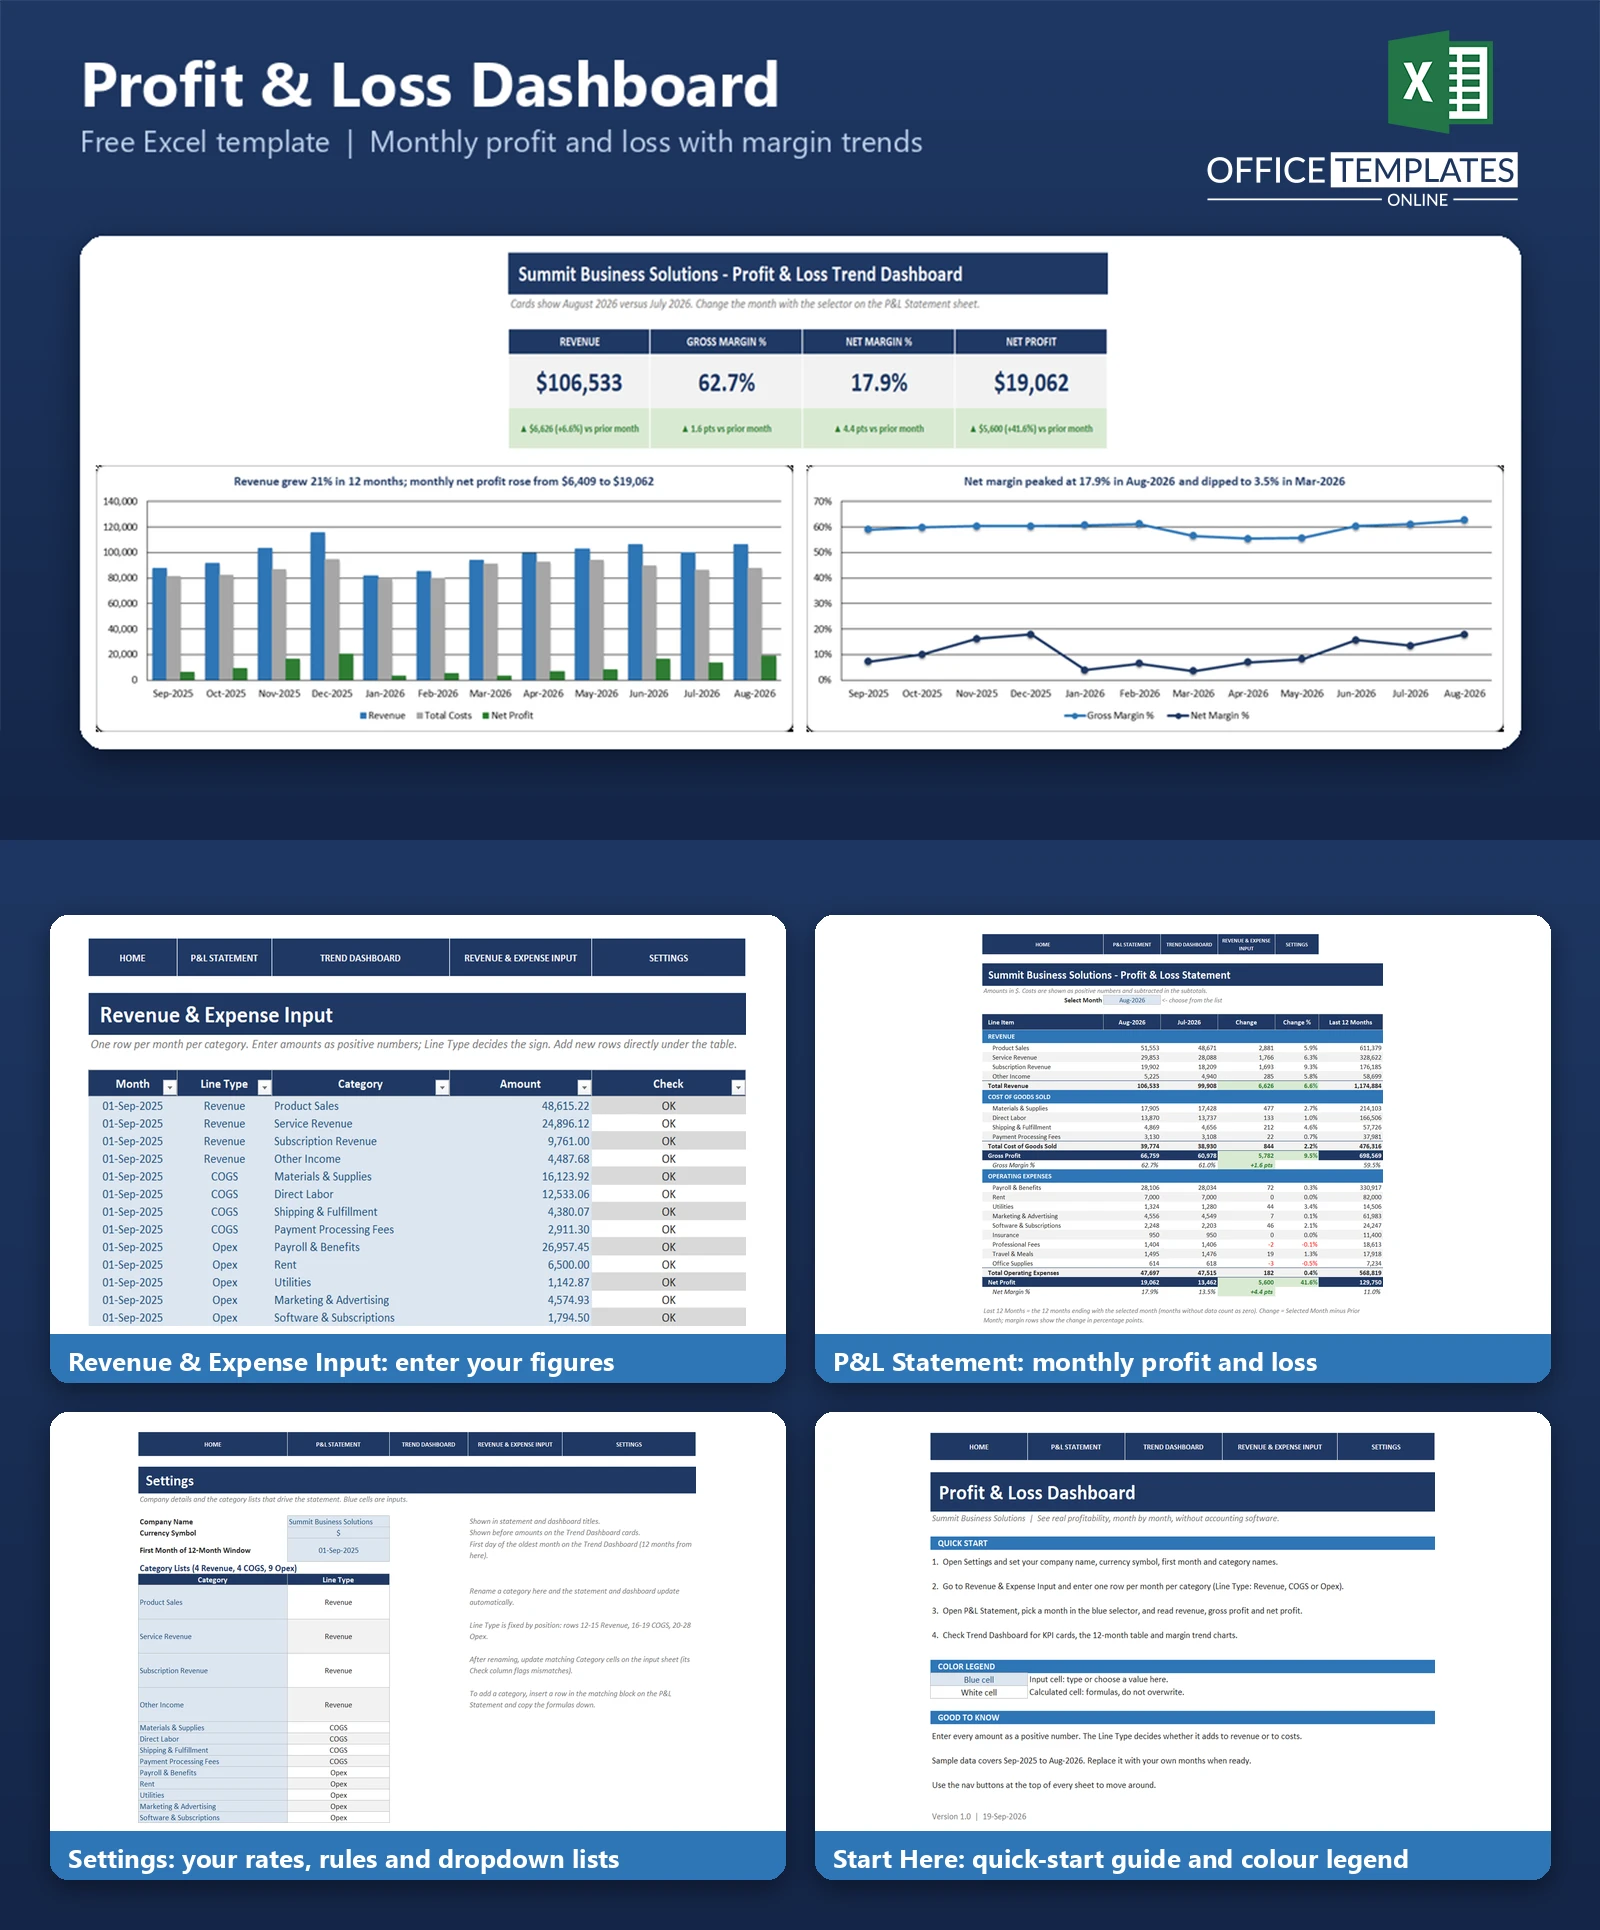
Knowing whether your business is truly profitable should not require accounting software. This profit and loss template for Excel turns a simple list of monthly revenue and expense amounts into a clean, standard P&L statement, complete with gross margin, net margin, and a 12-month trend.
Pick any month and the statement instantly shows revenue, cost of goods sold, gross profit, operating expenses, and net profit, side by side with the prior month and a last-12-months total. A dashboard adds KPI cards and charts so you can see at a glance whether margins are improving or slipping.
Everything runs on standard Excel formulas. There are no macros, no add-ins, and no subscriptions, so it works on any modern copy of Excel and is easy to adapt to your own categories.
Key Features
- Formatted P&L statement with Selected Month, Prior Month, Change, Change %, and Last 12 Months columns
- Gross Margin % and Net Margin % calculated automatically
- Month selector dropdown that updates the statement and KPI cards
- Four KPI cards with green and red change indicators versus the prior month
- 12-month trend table with two charts and data-driven insight titles
- Editable company name, currency symbol, and category lists
- Dropdowns and a Check column that catch category mistakes
- Print-ready statement and dashboard, one page each
What You Can Track
- Revenue by category, such as product sales, services and subscriptions
- Cost of goods sold, including materials, direct labor, and fulfillment
- Operating expenses such as payroll, rent, marketing, and software
- Gross profit and net profit month by month
- Gross and net margin percentages and their movement in percentage points
Dashboard & Reports
The P&L Statement sheet is a printable, vertical financial statement for the month you select. The Trend Dashboard shows Revenue, Gross Margin %, Net Margin %, and Net Profit cards with the change from the prior month, a 12-month table, a clustered column chart of revenue, total costs, and net profit, and a line chart of gross and net margin trends.
Who Is This Template For
- Small business owners who want a standard P&L without accounting software
- Freelancers and consultants reviewing monthly profitability
- Managers preparing a one-page financial summary for a bank, investor, or accountant
- Anyone comparing profit performance period over period
How to Use the Template
- Open Settings and enter your company name, currency symbol, first month, and category names.
- Enter one row per month per category on Revenue & Expense Input, choosing the Line Type and Category from the dropdowns.
- Open the P&L Statement and choose a month in the blue selector cell.
- Review the Trend Dashboard for KPI cards and margin trends.
Benefits
- See real profitability instead of guessing from the bank balance
- Spot margin squeezes early by watching the monthly trend
- Save time with a statement that builds itself from your data
- Present a professional P&L without paying for software
Excel Requirements
Works in Excel 2010 and later, including Microsoft 365. The template uses standard functions only (SUMIFS, IFERROR, EDATE, TEXT, and similar) and contains no macros, so nothing needs to be enabled and it is safe to open.
Frequently Asked Questions
Does this template need macros?
No. It uses only standard Excel formulas and contains no macros or VBA.
How are costs and revenue treated?
Enter every amount as a positive number. The Line Type (Revenue, COGS, or Opex) tells the statement whether to add or subtract it.
Can I change the categories?
Yes. Rename categories in Settings and update matching rows on the input sheet. A Check column highlights any mismatch.
Which months does the statement cover?
You choose any month from the 12-month window with the dropdown. It shows that month, the prior month, and the last 12 months ending in the selected month.
Is this a budget comparison?
No. It is a profit and loss statement with margin trends. It does not compare against a budget.
How do I replace the sample data?
Delete the sample rows in the input table, enter your own months, and set the first month in Settings.
Does it include accruals or taxes?
No. It summarizes monthly revenue and expenses; it is not a full accounting system.