Free Excel Sales Pipeline Template for Tracking Deals and Forecasting Revenue
Most small sales teams start tracking deals in a spreadsheet, a notes app, or scattered email threads - and it works, until it doesn't. Deals go quiet without anyone noticing, revenue forecasts turn into guesswork, and nobody can say with confidence how much business is actually likely to close this quarter.
The Sales Pipeline & Deal Tracker is a free Excel template built for B2B sales reps and small sales teams who want a straightforward way to log deals, see them move through stages, and get an automatically weighted revenue forecast - without setting up a CRM platform or writing a single formula themselves.
Log a deal once with its value, stage, and expected close date, and the workbook takes it from there: it calculates a probability-weighted forecast for every open deal, flags opportunities that have been sitting too long in a stage, and rolls everything into a dashboard and a 6-month forecast report - all with real formulas that recalculate automatically as you update your pipeline.
Key Features
- Weighted revenue forecasting - every deal's value is automatically multiplied by its stage win-probability, so your forecast reflects real likelihood, not just wishful totals.
- Stalled-deal alerts - deals that have sat in a stage past a threshold you set are automatically flagged amber (30+ days) or red (60+ days).
- Configurable pipeline stages - set your own stage names and win probabilities on the Settings sheet; the Deals sheet dropdown and every formula follow automatically.
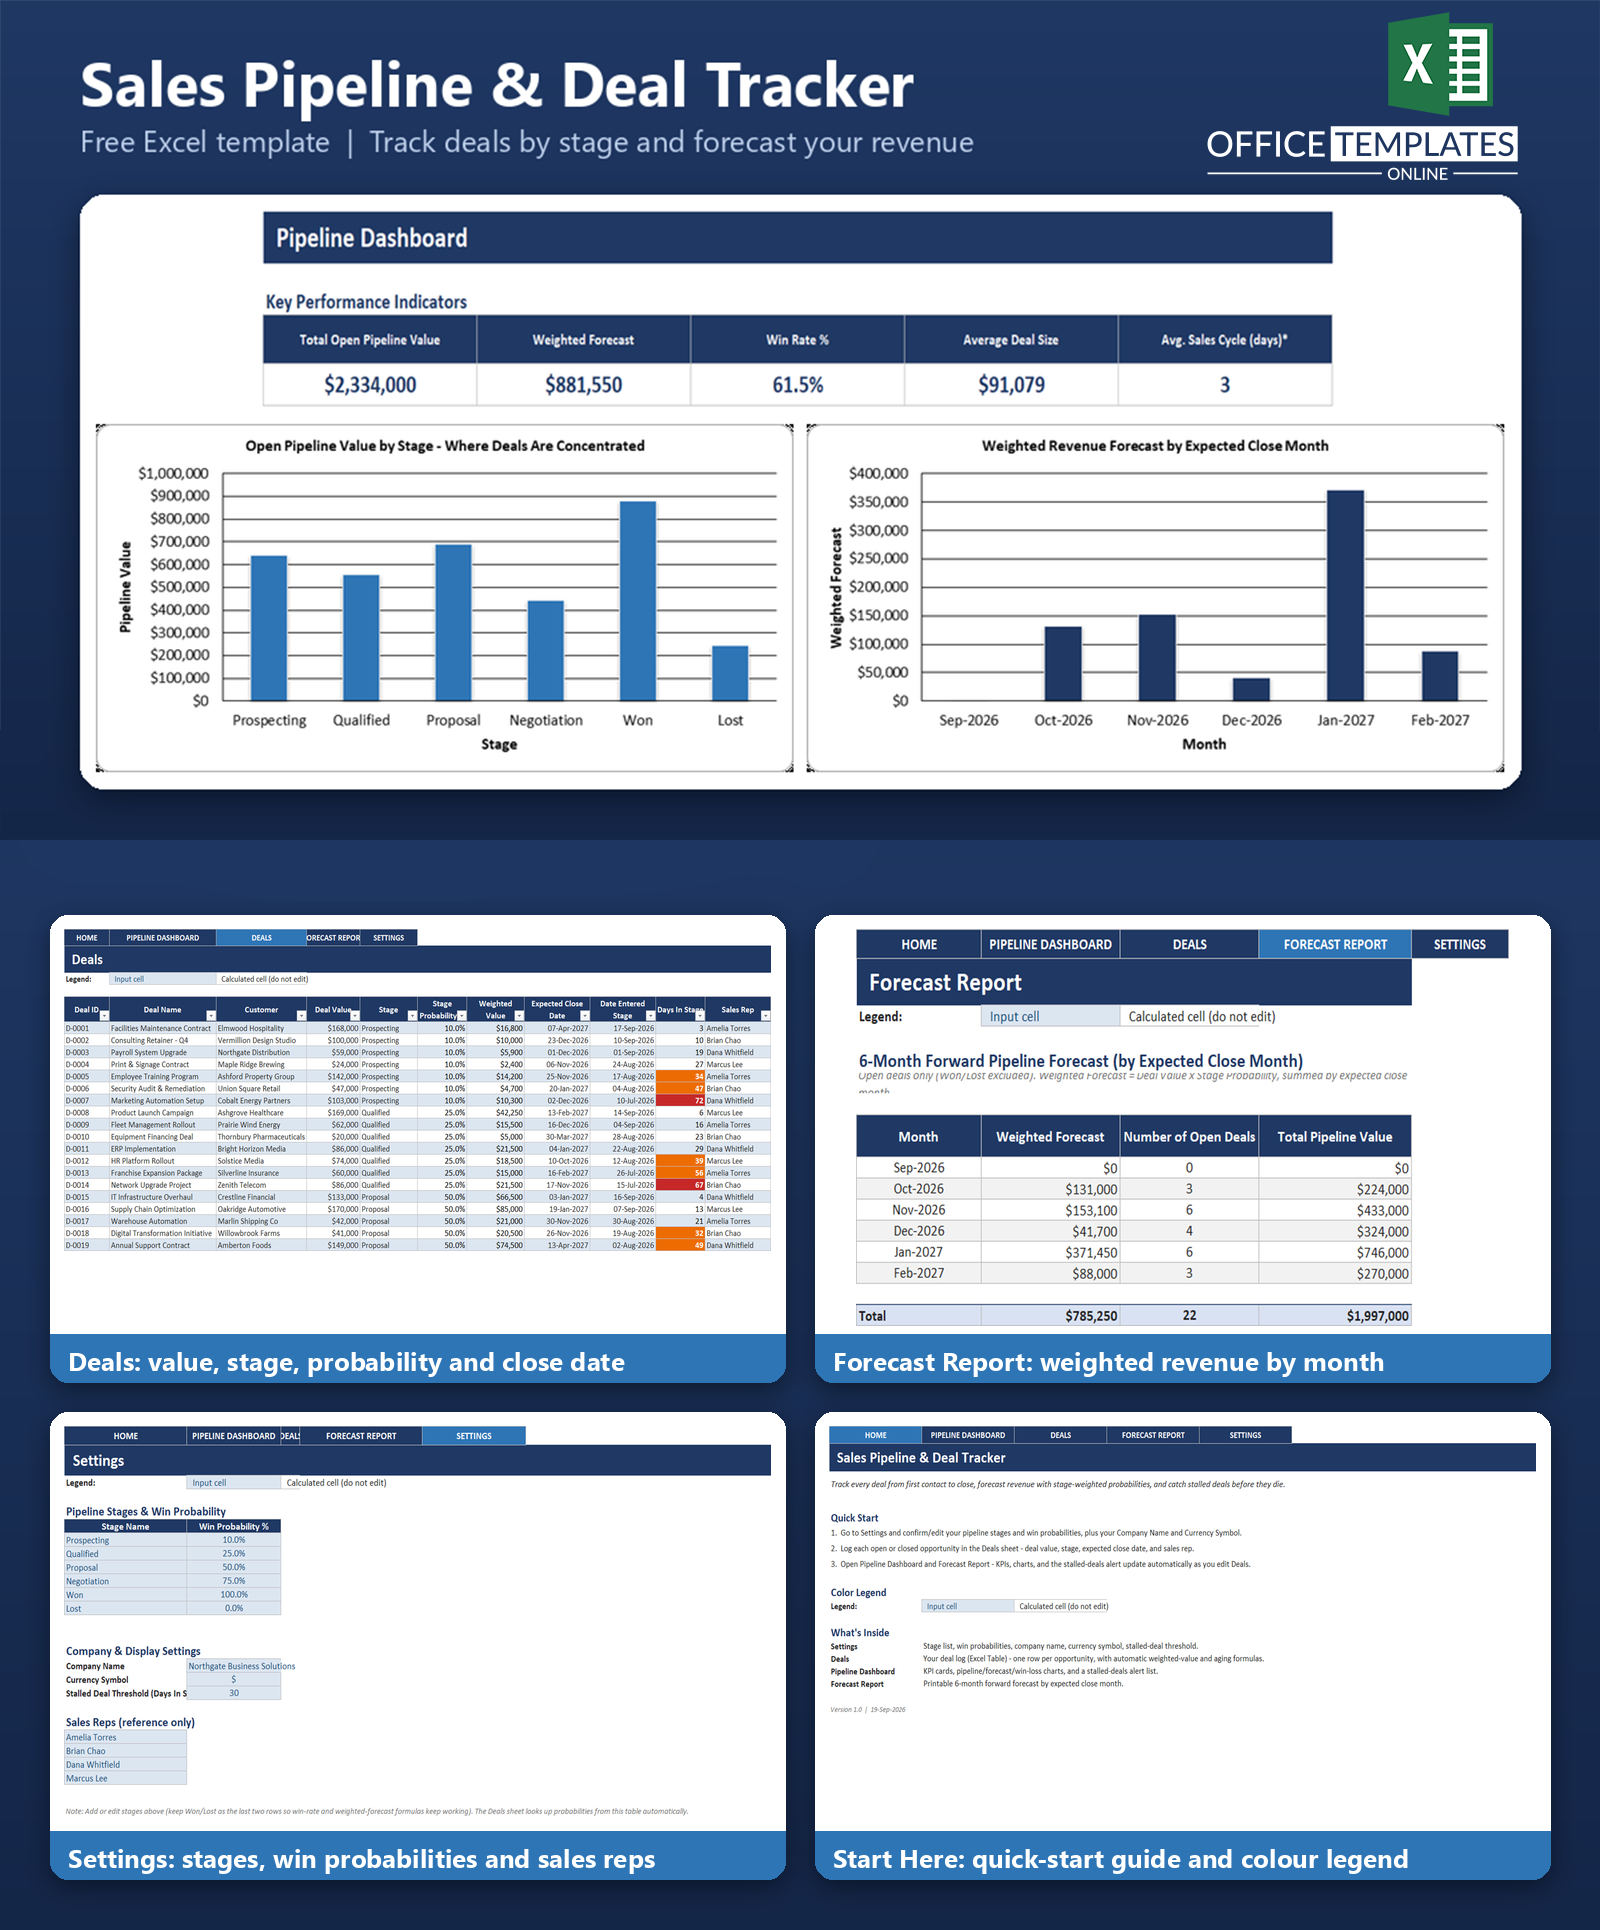
- Automatic dashboard - KPI cards, three charts, and a live stalled-deals list update the moment you edit a deal.
- 6-month forecast report - a clean, printable table showing expected weighted revenue, open deal counts, and total pipeline value by month.
- No macros required - built entirely with standard Excel formulas and formatting, so it opens safely in any modern desktop Excel with macros disabled.
What You Can Track
- Deal ID, deal name, and customer for every opportunity
- Deal value and current pipeline stage
- Win probability and weighted (forecasted) value for each deal, calculated automatically
- Expected close date and the date each deal entered its current stage
- Days in stage, to see at a glance which deals are moving and which are stuck
- Sales rep assigned to each deal
- Won and lost outcomes, for win-rate and pipeline reporting
Dashboard & Reports
Pipeline Dashboard
Five KPI cards give an instant read on the pipeline: Total Open Pipeline Value, Weighted Forecast, Win Rate %, Average Deal Size, and an approximate Average Sales Cycle (in days). Below the KPIs, three charts show Open Pipeline Value by Stage, Weighted Revenue Forecast by Expected Close Month, and Win/Loss counts for closed deals. A Stalled Deals Alert table lists every open deal whose time in its current stage has passed the threshold set on the Settings sheet, color-coded amber or red so nothing gets lost.
Forecast Report
A printable, month-by-month table covering the next six months by expected close date: Weighted Forecast, Number of Open Deals, and Total Pipeline Value for each month, plus a total row. Column widths and the print area are pre-set so it prints cleanly for a pipeline review meeting.
Who Is This Template For
- B2B sales reps who want a simple, personal way to track and forecast their own pipeline
- Small sales teams who share one workbook instead of a full CRM platform
- Sales managers who want a quick view of forecasted revenue and stalled deals before a pipeline review
- Founders and small business owners managing their own sales pipeline alongside everything else
How to Use the Template
- Open the Settings sheet and confirm or edit your pipeline stages, win probabilities, company name, currency symbol, and stalled-deal day threshold.
- Go to the Deals sheet and log each opportunity: deal name, customer, value, stage (chosen from a dropdown), expected close date, date entered stage, and sales rep.
- Open the Pipeline Dashboard to see KPIs, charts, and the stalled-deals alert update automatically.
- Check the Forecast Report for a clean, printable month-by-month revenue forecast.
- As deals move stages or close, just update the Stage and Date Entered Stage columns - every calculation follows automatically.
Benefits
- Replaces guesswork with a formula-based weighted forecast tied to your own stage probabilities.
- Surfaces stalled deals automatically instead of relying on someone remembering to check.
- Keeps the whole pipeline in one file that's easy to share, back up, and review with a team.
- No subscription, no login, and no learning curve beyond typing into a spreadsheet.
- Works entirely offline in Excel, with clear, readable formulas you can inspect or adapt yourself.
Excel Requirements
This template contains no macros or VBA. It is a standard .xlsx file built with Excel Tables, data validation dropdowns, conditional formatting, and formulas such as SUMIFS, COUNTIFS, INDEX/MATCH, IFERROR, and SUMPRODUCT. It is built and tested for modern desktop Excel (Microsoft 365 and Excel 2016 or later) and opens safely with macros disabled.
FAQ
Do I need any add-ins or a CRM subscription to use this?
No. The template is a single Excel file with no macros, add-ins, or external connections. Everything runs on standard Excel formulas.
How is the weighted forecast calculated?
Each deal's Weighted Value is its Deal Value multiplied by the Stage Probability % looked up from your Settings stage table. The Weighted Forecast KPI and the monthly forecast report sum this figure across open (not Won/Lost) deals.
Can I change the pipeline stages or win probabilities?
Yes. Edit the Stage Name and Win Probability % table on the Settings sheet. Every formula in the Deals sheet and dashboard reads from that table automatically, so there's nothing else to update.
What counts as a 'stalled' deal?
Any open deal (not Won or Lost) whose Days In Stage - calculated from the Date Entered Stage you enter - exceeds the threshold set on the Settings sheet (30 days by default). The Deals sheet also shades Days In Stage amber past 30 days and red past 60 days.
Is this a CRM or contact management tool?
No. This template is deal/opportunity-centric, focused on stage tracking and weighted revenue forecasting. It intentionally does not include a contact or follow-up log; that is better handled by a separate CRM-style tool.
How do I remove the sample deals and start fresh?
Select the sample rows on the Deals sheet, delete the table rows (not just the cell contents), and start entering your own deals in the first empty row - the table and its formulas extend automatically.
Can multiple people use this at the same time?
It's built as a single-user workbook. Multiple people editing the same file at once (for example, over a shared network drive) can cause conflicts, so it works best with one owner or a controlled hand-off.
Does the currency symbol update automatically if I change it in Settings?
The Settings currency symbol is there for your reference and for labeling; because Excel number formats can't read a cell value without macros, changing it doesn't automatically reformat the currency columns. You can update the number format on those columns directly if you use a different currency.

← Previous Article
Free Excel Sales Dashboard Template for Small BusinessesYou may also like