Free Excel Billable Hours & Client Billing Tracker Template
If you bill clients by the hour, the hardest part usually isn't doing the work - it's turning a week of scattered notes and timesheets into an accurate invoice. Hours get logged in different places, rates get mixed up between clients, and it's easy to lose track of what has actually been billed versus what is still sitting unpaid.
This free Excel template gives consultants, agencies, and freelancers a single place to log time against a client and project, apply the right hourly rate automatically, and see exactly how much has been billed, invoiced, or is still unbilled. It also tracks utilization rate, so you can see how much of everyone's time is actually generating revenue.
Everything runs on standard Excel formulas - no macros, no add-ins, and no manual rate lookups. Enter the hours; the template calculates the rest.
Key Features
- One time-entry table for logging date, consultant, client, project/task, hours, billable status, and billed status
- Billing rate looked up automatically from each client's record - no re-typing or memorizing rates.
- Billable Amount calculated automatically (hours x client rate), and only for billable time
- Built-in 'Internal/Admin' client for tracking non-billable internal time separately
- Row Check column flags entries with a missing client, consultant, or hours value.
- Automatic summaries by client, by consultant, and by month
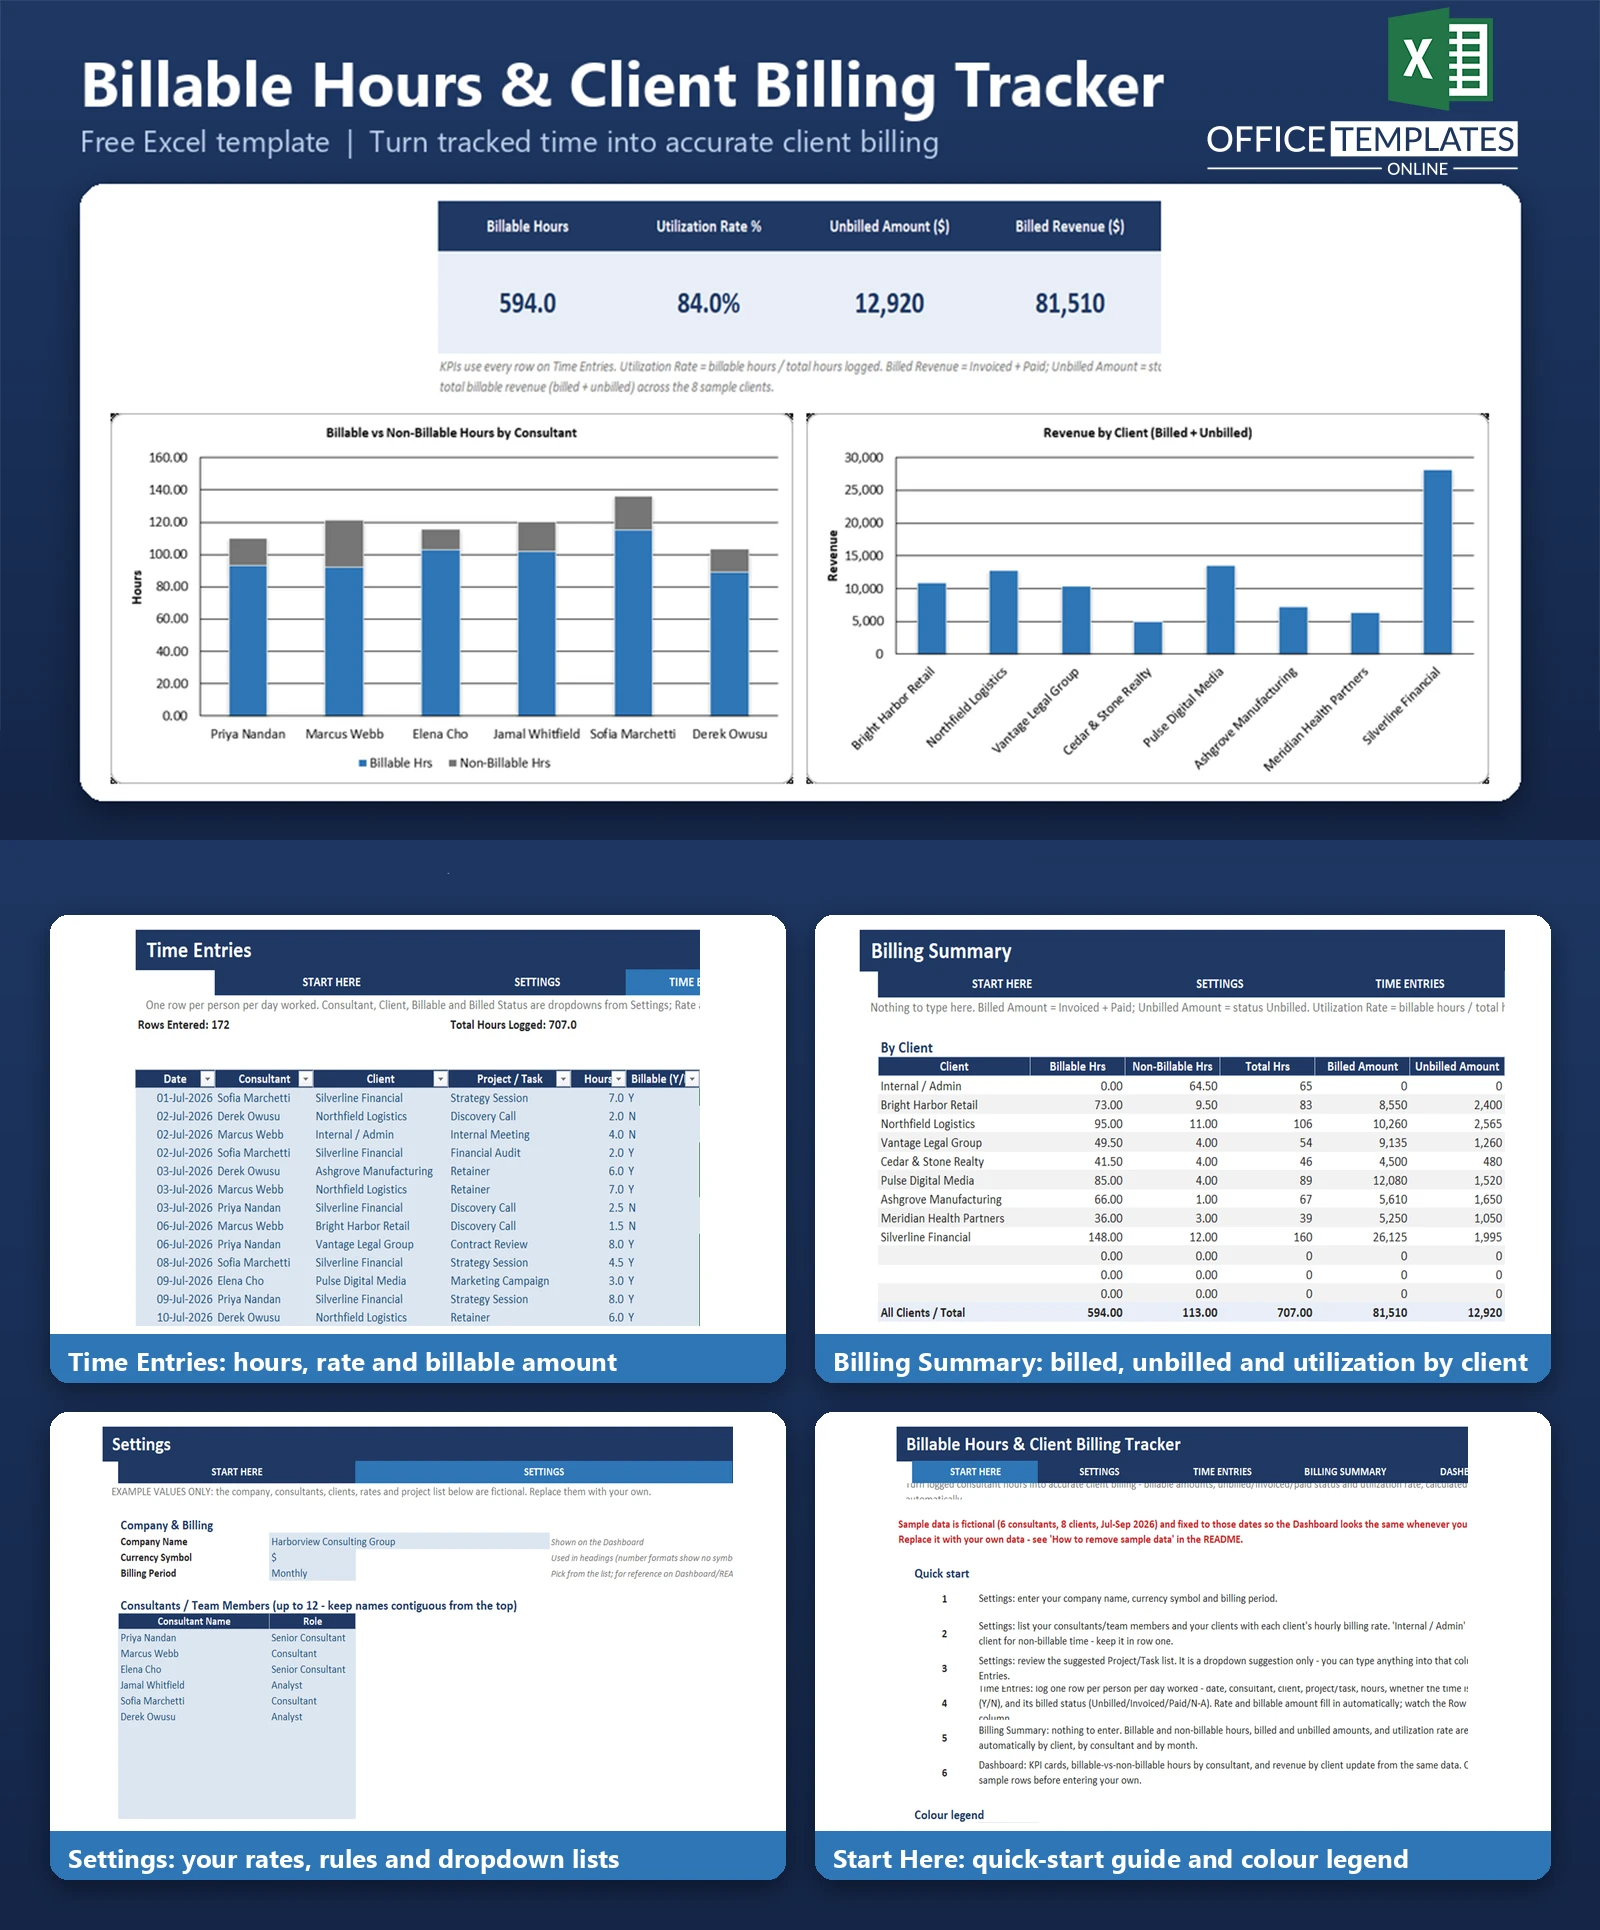
- Dashboard with KPI cards and charts for billable hours, utilization, unbilled amount, and revenue by client
- Dropdown lists for consultants, clients, billable status and billed status; a suggested project/task list you can also override
- No macros - built entirely with standard Excel formulas and Tables
What You Can Track
- Hours worked per consultant, per client, and per project/task
- Whether time is billable or non-billable
- Billed status for every entry - Unbilled, Invoiced, Paid, or N/A for non-billable time.
- Billable amount per entry, calculated from each client's hourly rate
- Billed revenue versus unbilled revenue, by client and by month
- Utilization rate - the share of logged hours that is actually billable - overall, per client and per consultant
Dashboard & Reports
The Dashboard brings the numbers together in one view: five KPI cards show total Billable Hours, Utilization Rate %, Unbilled Amount, Billed Revenue, and the Top Client by Revenue. Below the KPIs, two charts show Billable vs. Non-Billable Hours by Consultant (so you can spot who has spare capacity) and Revenue by Client (so you can see where the income is actually coming from).
The Billing Summary sheet backs up the Dashboard with three detailed tables - by client, by consultant, and by month - each showing billable and non-billable hours, billed and unbilled amounts, and utilization rate, calculated automatically from the time entries.
Who Is This Template For
- Independent consultants who bill multiple clients at different hourly rates
- Small agencies tracking billable time across a team of consultants
- Freelancers who need a simple way to see what they've earned versus what's still unbilled
- Anyone who currently tracks billable hours in a notebook, generic timesheet, or scattered spreadsheets and wants the billing math done automatically
How to Use the Template
- Open the Settings sheet and enter your company name, currency symbol, and billing period.
- List your consultants/team members and your clients, along with each client's hourly billing rate. Keep 'Internal/Admin' as the first client row for non-billable time.
- Review the suggested Project/Task list, or leave it as a starting point - you can type any text into that column.
- Go to Time Entries and log one row per person per day worked: date, consultant, client, project/task, hours, whether it's billable, and its billed status.
- Check the Billing Summary sheet - billable/non-billable hours, billed and unbilled amounts, and utilization rate are already totalled by client, consultant, and month.
- Open the Dashboard to see the KPI cards and charts update automatically.
- Clear the sample data before entering your own (see the README that ships with the template for the exact steps).
Benefits
- Saves time by removing manual rate look-ups and billing calculations
- Reduces billing errors by calculating billable amounts consistently, every time
- Gives a clear, up-to-date view of unbilled work so nothing falls through the cracks
- Shows utilization at a glance, helping you balance workloads across a team
- Works entirely offline in a spreadsheet you already own - no subscription or software to learn
Excel Requirements
This template uses standard Excel formulas (SUMIFS, INDEX, MATCH, IF, IFERROR, TEXT, and similar) and an Excel Table - there are no macros and nothing to enable. It is built for modern desktop Excel (Excel 2016 or later, or Microsoft 365). It has not been tested in Excel Online or the mobile Excel apps, where some chart formatting may look slightly different.
Frequently Asked Questions
Does this template send invoices automatically?
No. It calculates billable amounts and tracks billed vs. unbilled status, but it does not generate or send PDF invoices. You would use the Unbilled Amount figures to create invoices in your own invoicing tool or template.
Can I use different hourly rates for different clients?
Yes. Each client on the Settings sheet has its own hourly rate, which is looked up automatically whenever you select that client on a time entry - you never have to re-type a rate.
How does the template handle non-billable time?
Mark the entry as Billable = N. Non-billable rows are always calculated as $0 billable amount, but the hours still count toward total hours and the utilization rate calculation, and are shown separately in the Non-Billable Hours columns.
What does Utilization Rate mean here?
Utilization Rate is billable hours divided by total hours logged. It is shown overall on the Dashboard, and broken down by client and by consultant on the Billing Summary sheet.
How many consultants and clients can I add?
The Settings sheet has room for up to 12 consultants and up to 12 clients. The Time Entries table has capacity for 500 rows of time entries.
Does the Billing Summary update automatically as I add new months?
The By Month table lists specific month labels (e.g., Sep-2026). To add a new month, type its label into one of the pre-formatted blank rows provided - the formulas for six month slots are already in place.
Is there a limit to how many hours I can log per day?
The Hours field accepts values from 0 to 24 per row; log a separate row for each project or task worked on in a day.
Do I need to know Excel formulas to use this?
No. You only enter data into the blue input cells - dates, consultant, client, project, hours, billable flag, and billed status. All calculations, including the rate lookup and billable amount, happen automatically.

← Previous Article
Free Excel Job Costing Template for Contractors and TradespeopleYou may also like