Free Excel Job Costing Template for Contractors and Tradespeople
Most contractors and tradespeople price a job from experience - a rough sense of materials, a day rate for labor, and a gut-feel markup. It works, until it doesn't: a job that felt profitable at the time turns out to have barely covered the cost of materials and labor once overhead is added in, and there's no clear record of why.
This free Excel template is built for general contractors, remodelers, and trade specialists - electricians, plumbers, HVAC technicians, painters - who quote and complete jobs that mix materials with several types of labor. It gives you one place to build up the true cost of a job (materials, labor by trade, and an overhead allocation) and compare it to what you actually charged.
With the Contractor Job Costing Calculator, you enter materials and labor once per job, set your target margin and overhead rate one time in Settings, and let the spreadsheet calculate total cost, profit, and margin % automatically. Every job you log is flagged the moment its margin slips below your target, so underpriced work gets caught early instead of discovered at tax time.
Key Features
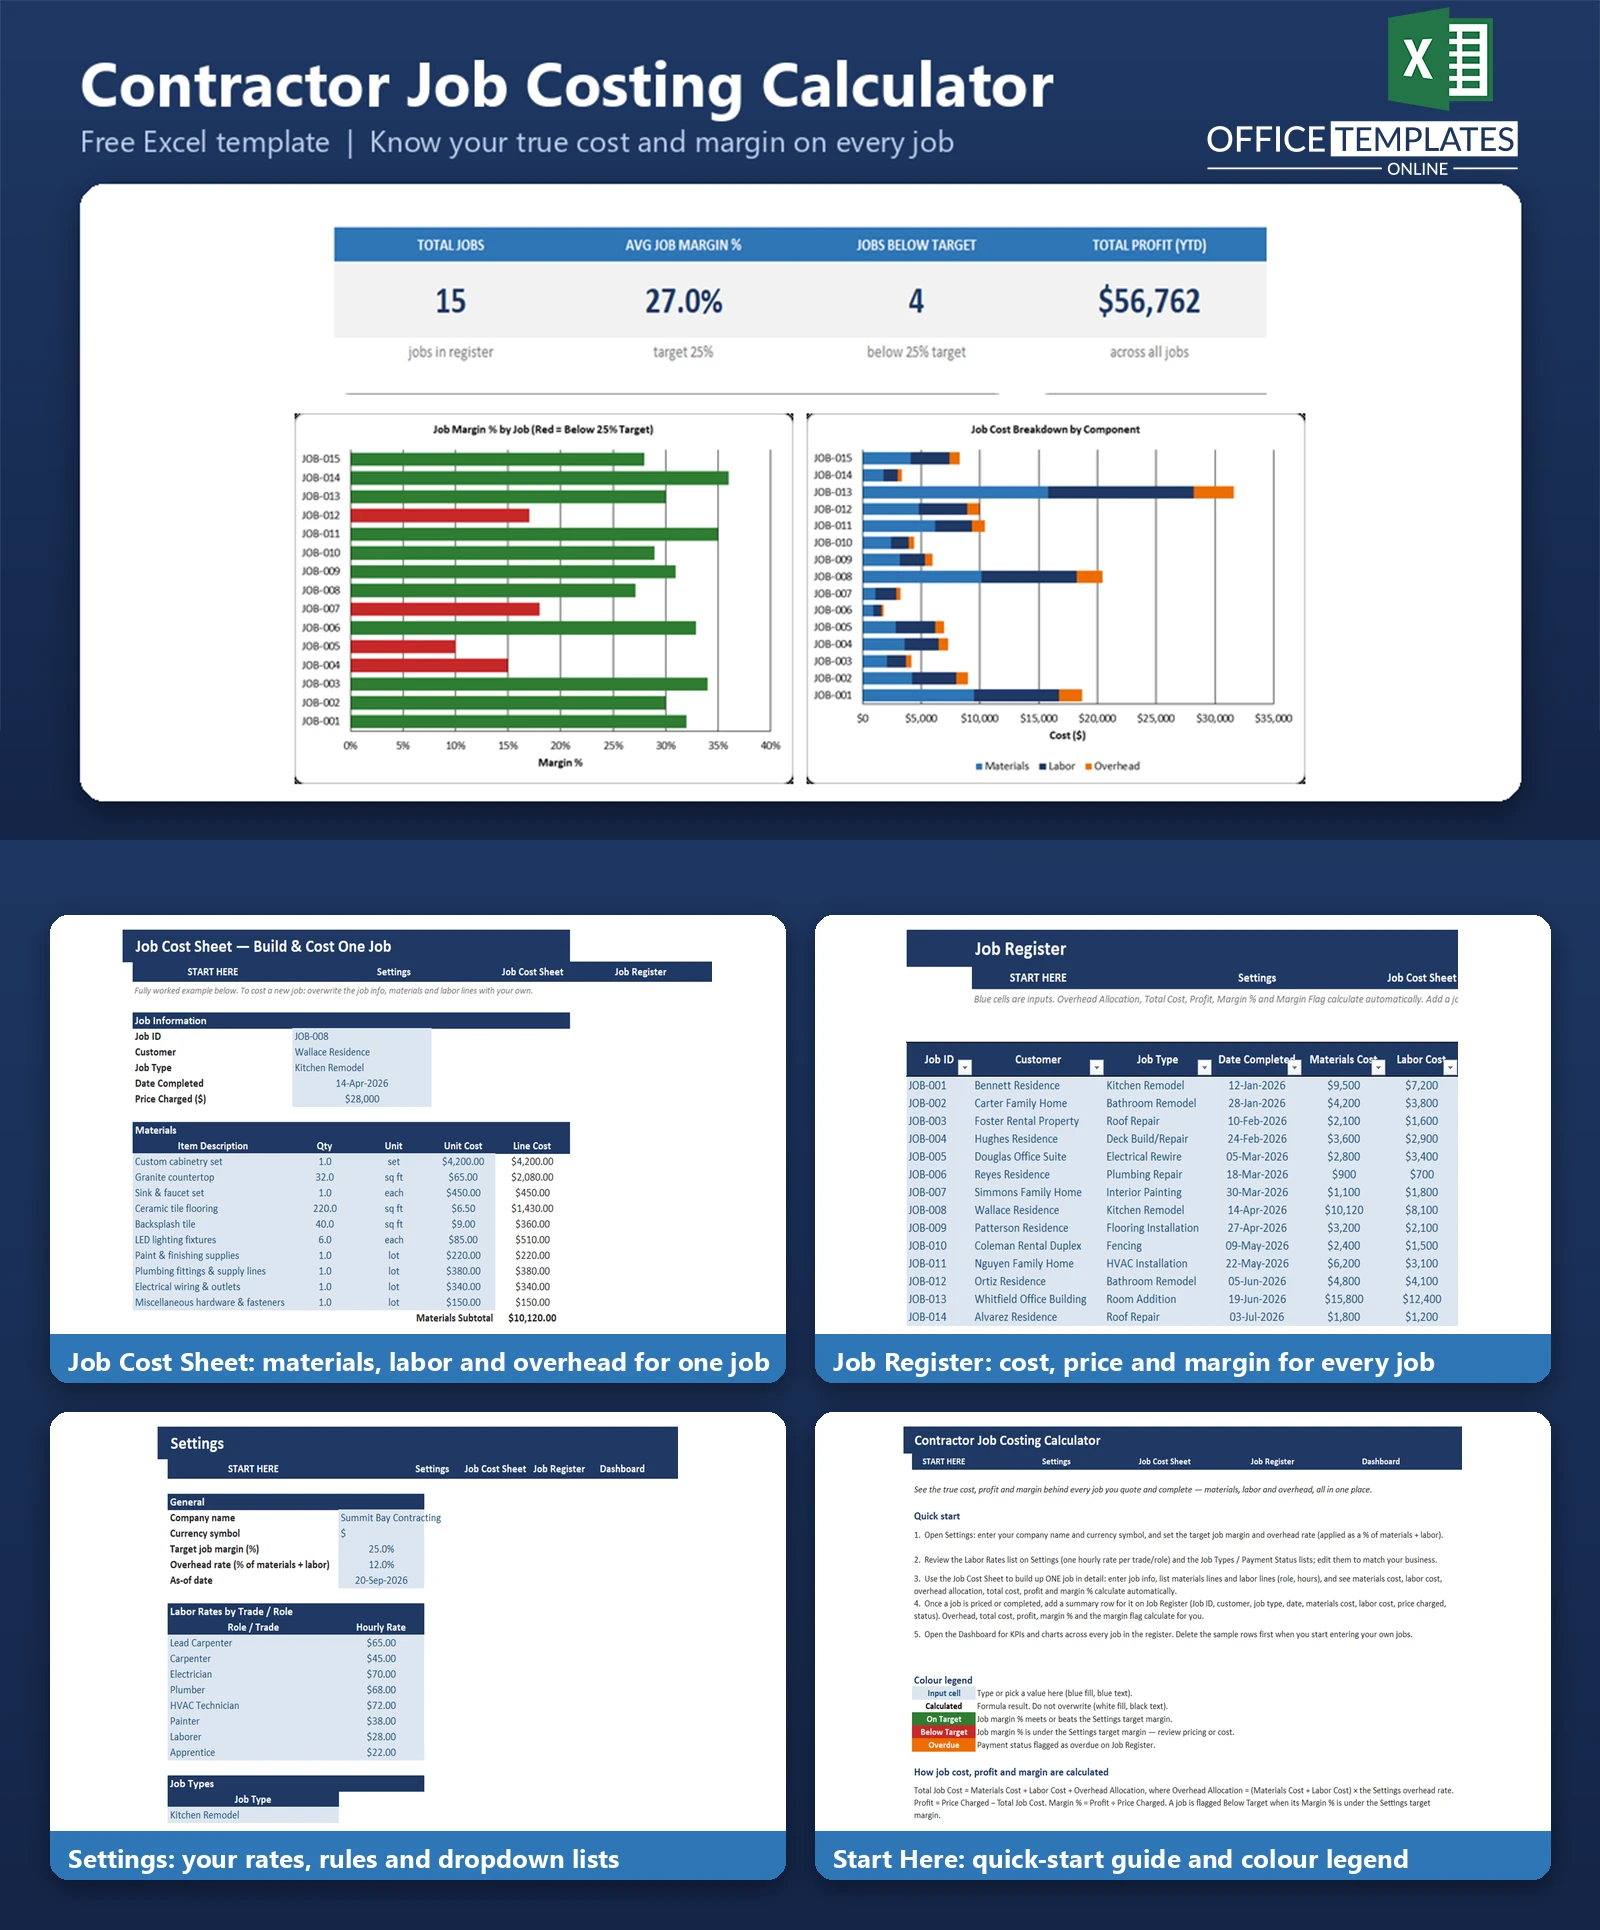
- Job Cost Sheet with itemized materials lines and labor lines by trade/role, fully worked with a sample job.
- Labor rates maintained once per trade/role in Settings and looked up automatically wherever you enter hours.
- Automatic overhead allocation as a percentage of materials plus labor, set once in Settings.
- Job Register table logging cost, price, profit and margin % for every job, with a Below Target flag
- Dashboard with KPI cards and charts summarizing margin performance and cost mix across every job
- Dropdown lists for job type, labor role/trade, and payment status, all editable in Settings
- No macros - built entirely from standard Excel formulas, so it opens safely on any modern Excel install.
What You Can Track
- Materials cost per job, itemized line by line (item, quantity, unit, unit cost)
- Labor cost per job, broken down by trade/role and hours worked
- Overhead allocation calculated from your Settings overhead rate
- Total job cost - materials, labor, and overhead combined
- Price charged to the customer
- Profit and profit margin % for every job
- Which jobs fall below your target margin
- Payment status (Paid, Invoiced, Overdue) for each job
Dashboard & Reports
The Dashboard brings every job in your Job Register into one view. A KPI strip across the top shows Total Jobs, Average Job Margin %, Jobs Below Target Margin, and Total Profit, so you can see at a glance whether your pricing is holding up. Below it, a Job Margin % by Job chart color-codes every job - green for on target, red for below target - making problem jobs immediately visible. A second chart, Job Cost Breakdown by Component, stacks materials, labor, and overhead for each job so you can see which cost is driving the total.
Who Is This Template For
- General contractors and remodelers quoting kitchens, bathrooms, additions, and similar multi-trade jobs
- Electricians, plumbers, HVAC technicians, and other trade specialists pricing jobs with several labor roles
- Small crews and owner-operators who currently price by instinct and want the numbers to confirm it
- Anyone who has been surprised, after the fact, that a job was less profitable than it looked
How to Use the Template
- Open Settings and enter your company name, currency symbol, target job margin, and overhead rate.
- Review the Labor Rates by Trade/Role list, Job Types list, and Payment Status list on Settings, and edit them to match your business.
- Use the Job Cost Sheet to build up a job in detail: enter job info, then list materials and labor lines.
- -Check the summary on the Job Cost Sheet: materials cost, labor cost, overhead, total cost, profit, and margin % all calculate automatically.
- Log a summary row for the job on Job Register once it's quoted or completed.
- Open the Dashboard to review margin performance and cost mix across all your jobs.
- Delete the sample data on Job Register and the Job Cost Sheet before entering your own jobs.
Benefits
- See the full cost of a job - materials, labor, and overhead - before you commit to a price.
- Catch underpriced jobs early with an automatic Below Target margin flag
- Keep labor rates in one place instead of re-checking them for every quote
- Get a portfolio-level view of margin and profit instead of checking each job individually
- No software to install and no macros to enable - it's a standard Excel workbook
Excel Requirements
This template contains no macros and uses only standard Excel formulas (SUMIFS, COUNTIFS, AVERAGEIF, INDEX/MATCH, IF, IFERROR, TEXT, and similar functions). It is designed for modern desktop versions of Microsoft Excel (Excel 2016 or later, or Microsoft 365). Dropdown lists, conditional formatting, and charts are built with native Excel features and do not require any add-ins.
Frequently Asked Questions
Does this template calculate overhead automatically?
Yes. You set an overhead rate once on the Settings sheet (as a percentage of materials plus labor), and every job's overhead allocation, total cost, profit, and margin % recalculate automatically from that rate.
Can I track labor for more than one trade on the same job?
Yes. The Job Cost Sheet has a labor line for each trade/role and the number of hours worked; each line's hourly rate is looked up automatically from the Labor Rates list on Settings, and the line costs are totaled for you.
How does the template flag underpriced jobs?
Every job on the Job Register is compared to the target margin % you set on Settings. Any job whose margin % comes in below that target is automatically labeled 'Below Target' and highlighted in red, both in the table and on the Dashboard's margin chart.
Can I change the labor rates or job types?
Yes. Both lists live on the Settings sheet and can be edited directly. Once updated, the new rates and job types are available anywhere in the workbook that uses a dropdown or a rate lookup.
Does the workbook include sample data?
Yes. It ships with 15 fictional completed jobs on the Job Register and one fully worked job on the Job Cost Sheet, so you can see how the calculations and charts behave before entering your own data. The README explains how to clear the sample data.
Is this template compatible with Excel Online or Google Sheets?
It's built and tested for modern desktop Excel. It contains no macros, so it should open in Excel Online, but dropdown validation and chart formatting are most reliable in desktop Excel. It has not been tested in Google Sheets.
Does it support a fixed overhead amount instead of a percentage?
Not currently. This template allocates overhead as a percentage of materials plus labor, applied consistently across every job. It does not include a fixed-dollar overhead option per job.
Will adding new jobs break the dashboard or the formulas?
No. The Job Register is a real Excel Table, so typing a new job in the row beneath it extends the table and copies the cost formulas down automatically. The Dashboard's charts read the first 15 jobs by default; the README explains how to extend that range if you add more.