Free Excel Break-Even Calculator for Small Businesses
Not sure how many units you need to sell, or how much revenue you need each month, just to cover your costs? This Break-Even & Profitability Calculator answers that question in minutes, right inside Excel. Enter your fixed costs, your price, and your variable cost per unit, and the workbook shows your break-even point, your margin of safety, and the profit you can expect.
Built for new businesses and anyone pricing a product or service, the template compares a worst, expected, and best-case scenario side by side. It also tells you how many units you need to hit a target monthly profit and flags clearly when a price is too low for any break-even to exist.
A Product Comparison sheet ranks your products by the contribution they make, and a Dashboard turns the numbers into KPI cards and charts you can read at a glance. There are no macros and no add-ins, so it works in any recent desktop version of Excel.
Key Features
- Break-even units (rounded up) and break-even revenue for three scenarios
- Units needed to reach your target monthly profit
- Contribution margin per unit and as a percentage, plus margin of safety
- Clear status: PROFITABLE, BELOW BREAK-EVEN, or NO BREAK-EVEN POSSIBLE
- Product comparison with contribution, share of total, rank, and profit after allocated fixed costs
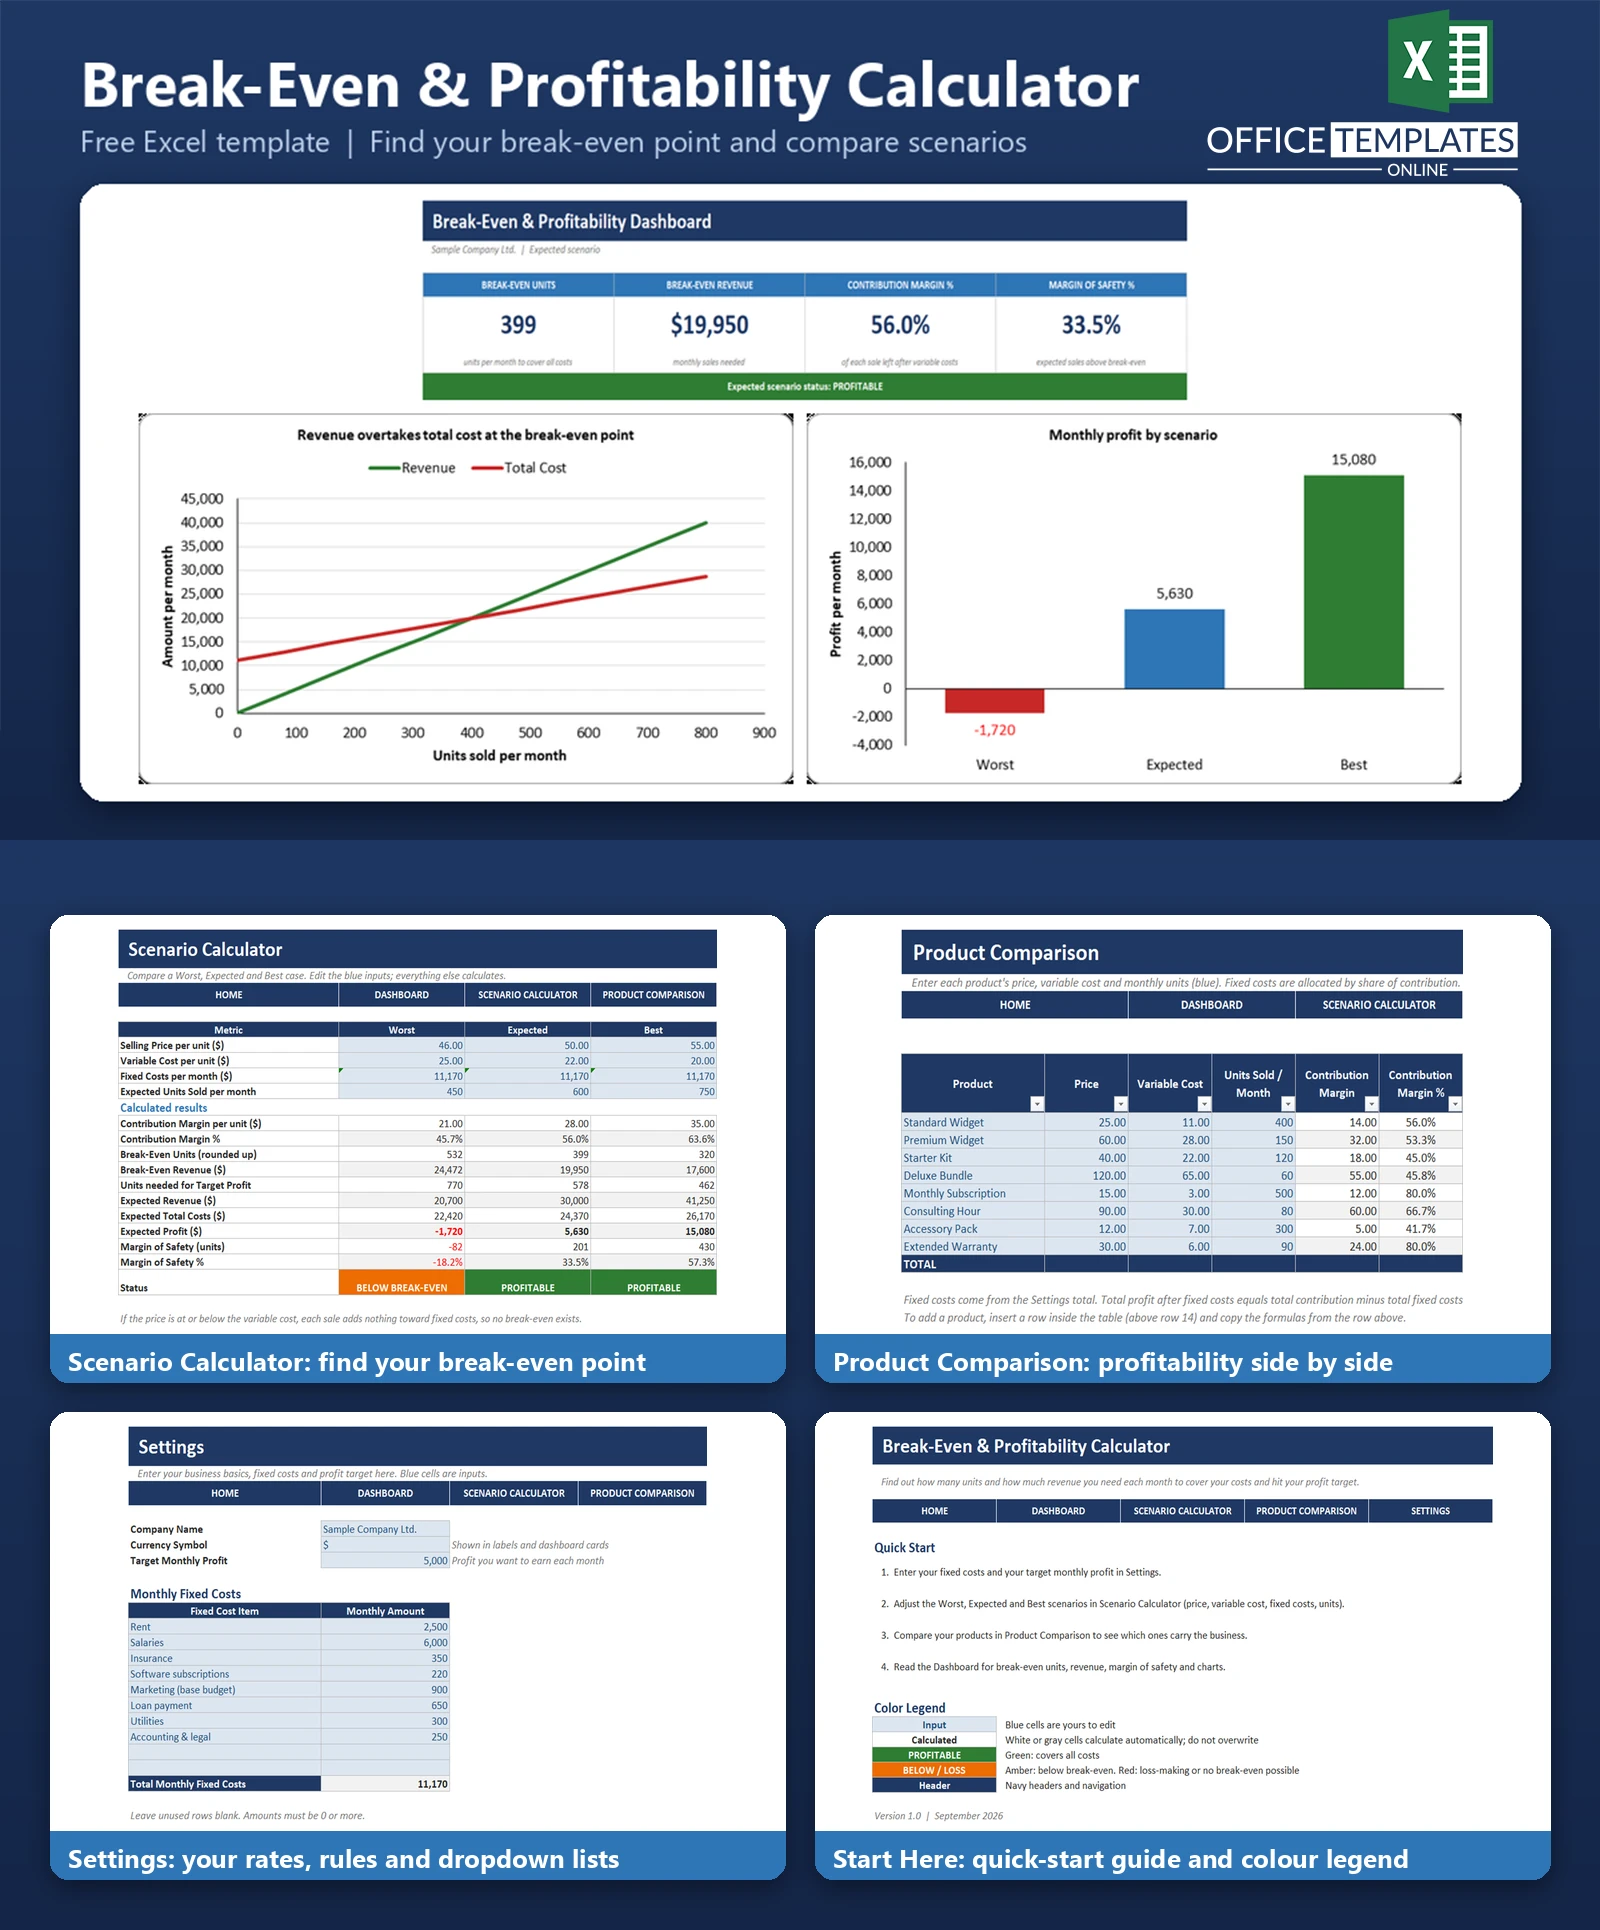
- Break-even chart where the revenue and cost lines cross at the break-even point
- Editable fixed cost list with currency symbol and company name settings
- Input validation on numeric cells and no macros
What You Can Track
- Monthly fixed costs such as rent, salaries, insurance, software, marketing, loan payments, utilities, and accounting
- Selling price and variable cost per unit for each scenario
- Expected units sold per month
- Target monthly profit
- Price, variable cost, and volume for up to eight products
Dashboard & Reports
The Dashboard shows four KPI cards for the expected scenario: Break-Even Units, Break-Even Revenue, Contribution Margin %, and Margin of Safety %. A status bar states whether the expected scenario is profitable.
- Break-even chart: revenue and total cost lines that cross at the break-even units
- Profit by scenario: a bar chart of worst, expected, and best monthly profit
- Monthly contribution by product: a bar chart showing which products carry the business
Who Is This Template For
- Founders and new business owners testing an idea before launch
- Freelancers and consultants setting hourly rates or package prices
- Small shops, cafes, and service businesses reviewing their prices
- Product managers and students learning cost-volume-profit analysis
How to Use the Template
- Enter your company name, currency symbol, target profit, and monthly fixed costs in Settings.
- Set price, variable cost, and expected units for the Worst, Expected, and Best scenarios in Scenario Calculator.
- List your products in Product Comparison to see contribution, rank, and profit after allocated fixed costs.
- Open the Dashboard to read break-even units, revenue, margin of safety, and the charts.
Benefits
- Know your break-even point before you commit to a price or a lease
- Set a realistic monthly sales target based on the profit you want
- Stress-test the downside with a worst-case scenario
- Spot the products that add the most, and the ones that lose money
- Save time: no formulas to build, and no macros to trust
Excel Requirements
The template is a standard .xlsx workbook that works in desktop Excel 2010 and later. It contains no macros, so there is nothing to enable and no security warning. It uses only long-established functions, so it does not need Microsoft 365 dynamic arrays.
Frequently Asked Questions
What is break-even analysis?
Break-even analysis finds the sales volume at which total revenue equals total costs, so you make neither a profit nor a loss. Above that volume, you earn a profit.
How is break-even calculated in the template?
Break-even units equal fixed costs divided by the contribution margin per unit (price minus variable cost), rounded up. Break-even revenue is break-even units times the price.
What happens if my price is lower than my variable cost?
Every sale then loses money, so no break-even exists. The template shows NO BREAK-EVEN POSSIBLE instead of an error.
Can I model different scenarios?
Yes. The Scenario Calculator has Worst, Expected, and Best columns with their own price, variable cost, fixed costs, and expected units.
Can I use it for services instead of products?
Yes. Treat an hour, a project, or a subscription as one unit, and enter its price and the direct cost of delivering it.
Does it work with my currency?
Yes. Type your currency symbol in Settings, and it appears in labels and dashboard cards.
Are macros required?
No. The workbook contains no macros or add-ins.

← Previous Article
Free Excel Profit and Loss Template with Margin DashboardYou may also like