Free Excel Daily Business Operations Dashboard Template for Small Business Owners
Most owners and managers start the day the same way: open the till report, check the bank balance, scan the task list, then ask around about anything that went wrong yesterday. Doing that across several systems or spreadsheets is slow, and it is easy to miss the one number that mattered.
This free Excel template gives you a single daily snapshot. Each evening (or first thing next morning) you type a few figures into a Daily Log: sales, cash on hand, tasks due and completed, issues or incidents, and a short note. The workbook does the comparing for you: yesterday, your trailing 7-day average, and your targets.
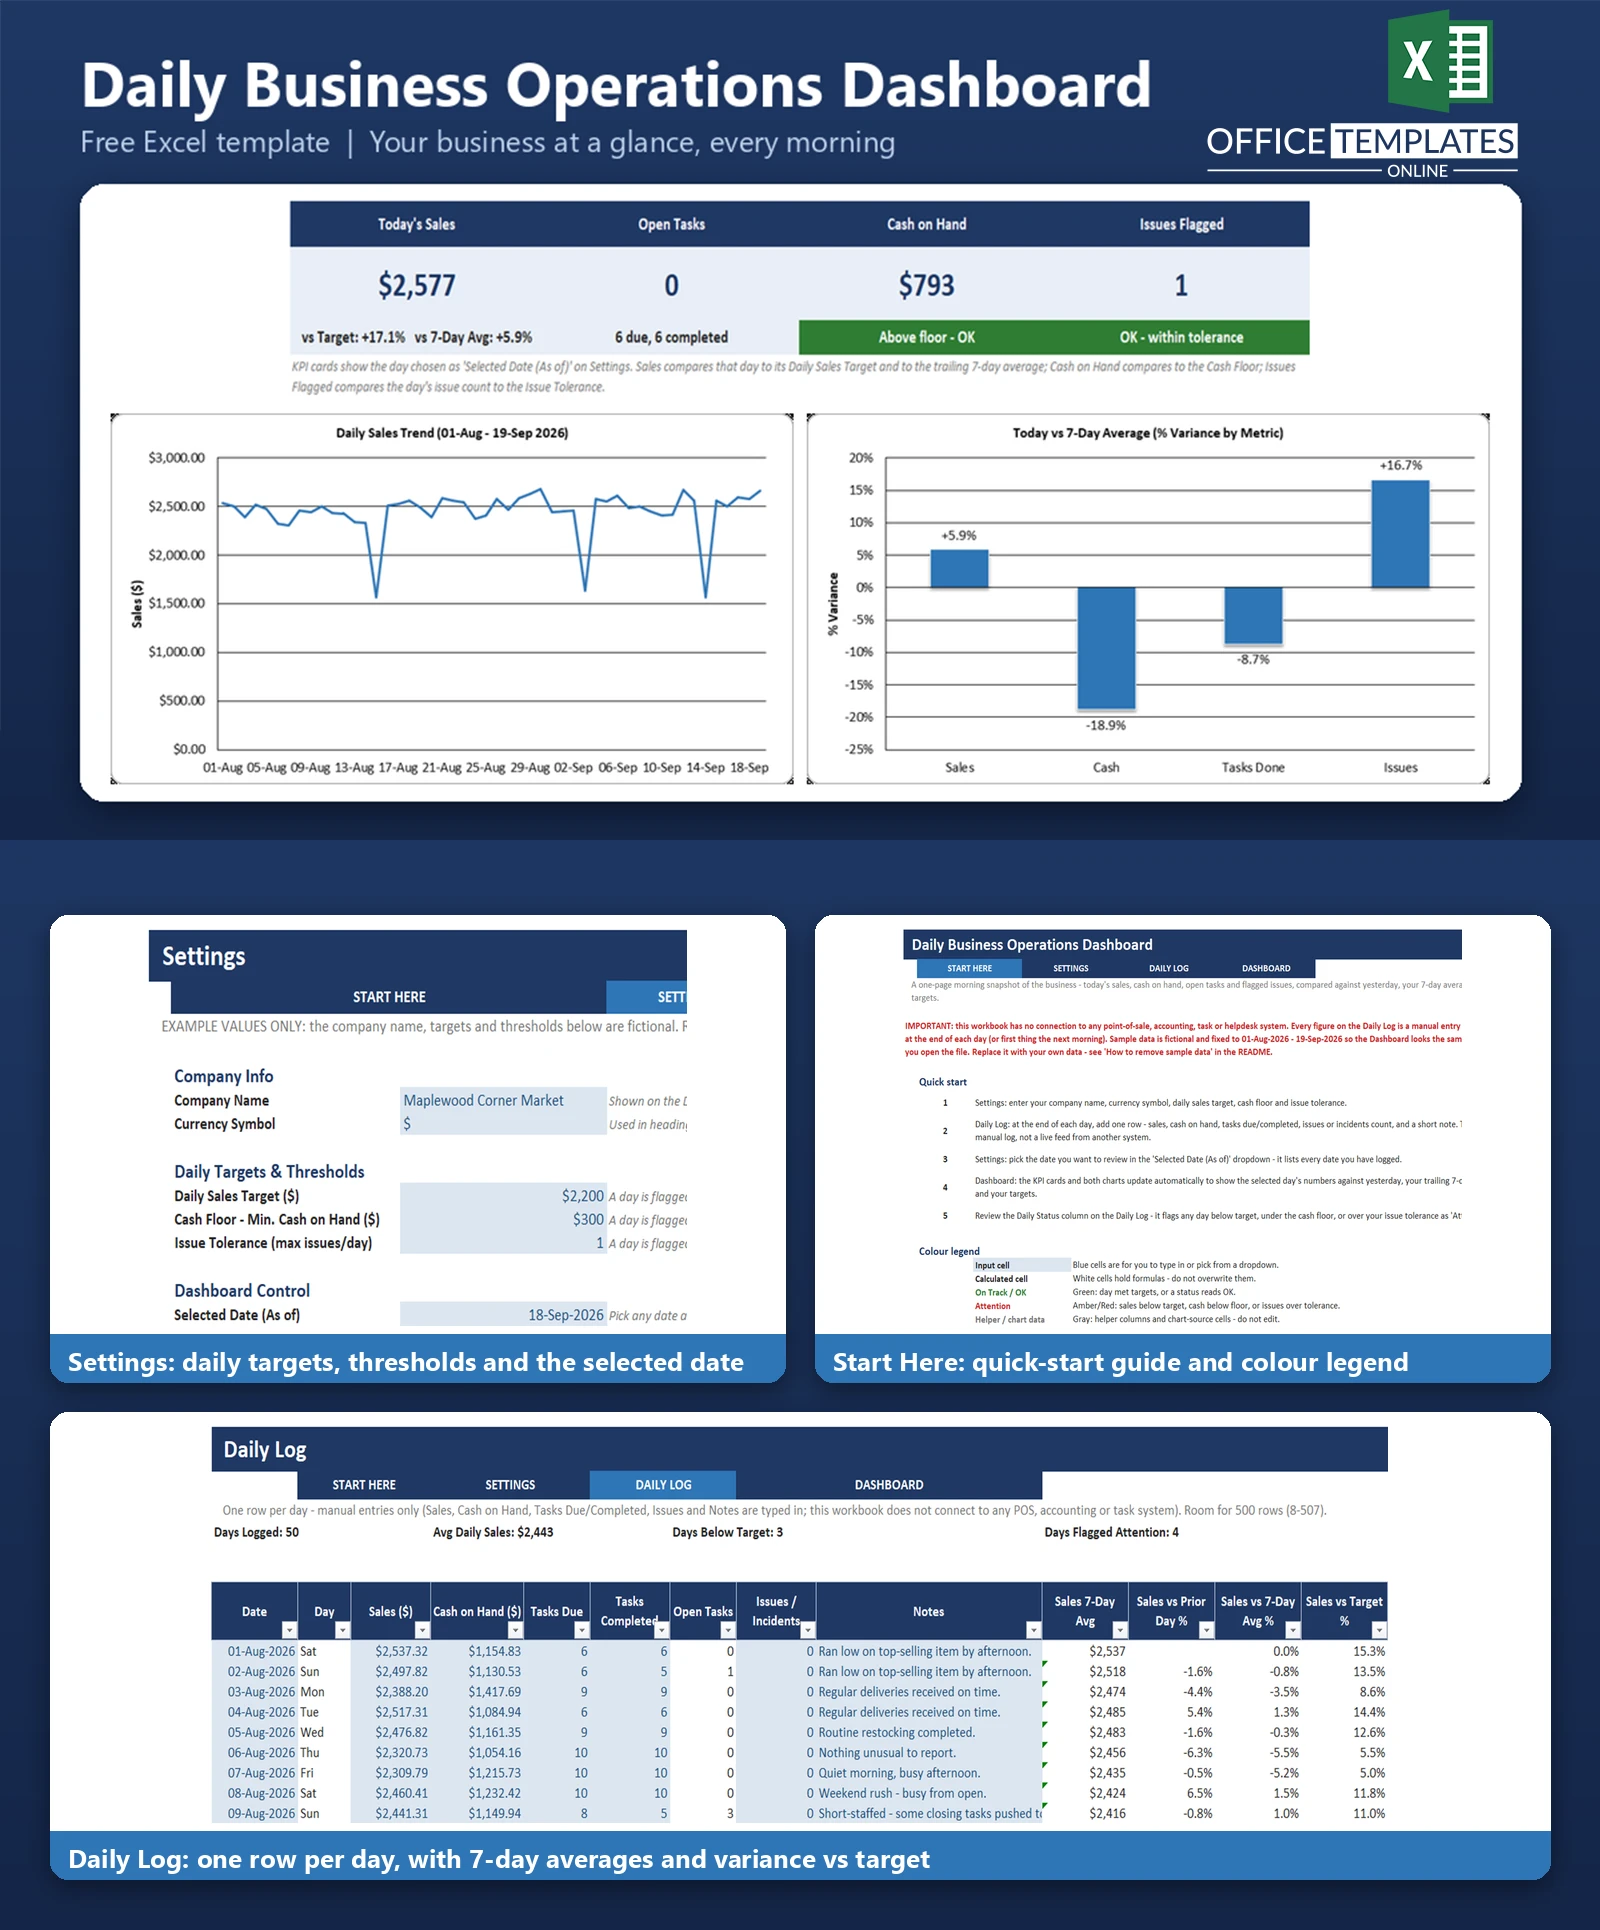
Pick a date on the Settings sheet and the Dashboard shows that day's Sales, Open Tasks, Cash on Hand, and Issues Flagged, plus a sales trend chart and a chart comparing the day with its 7-day average. Please note that every figure is entered by hand: the template does not connect to any point-of-sale, accounting, or task software.
Key Features
- Daily Log Excel Table with one row per day, room for 500 days
- Selected Date dropdown that drives the whole Dashboard
- Automatic Open Tasks, trailing 7-day averages, and Sales vs Prior Day, vs 7-Day Average, and vs Target percentages
- Daily Status flag (On Track or Attention) for low sales, low cash, or too many issues
- Four KPI cards and two charts, with colour-coded status messages
- Editable targets: daily sales target, cash floor and issue tolerance
- Fictional sample data for 50 days (01-Aug-2026 to 19-Sep-2026), including three rough days
What You Can Track
- Daily sales
- Cash on hand at close
- Tasks due and tasks completed (open tasks are calculated)
- Issues or incidents count, with a free-text note
- Trailing 7-day averages for sales, cash, tasks completed, and issues
Dashboard & Reports
The Dashboard opens with four KPI cards for the selected day. Today's Sales shows the amount with its variance against target and against the 7-day average. Open Tasks shows tasks still open, Cash on Hand shows a floor check, and Issues Flagged shows whether the day is within your tolerance.
Below are two charts: a Daily Sales Trend line across the whole logged period, where dips are easy to spot, and a Today vs 7-Day Average bar chart showing the percentage variance for sales, cash, tasks completed, and issues. The Daily Log itself highlights attention days in red and low-cash days in amber.
Who Is This Template For
- Owners of shops, cafes, and small retail or service businesses
- Managers who need a quick morning pulse-check
- Clinics, workshops and studios tracking a few daily numbers
- Anyone who wants a short-window daily view rather than a monthly KPI report
How to Use the Template
- Open Settings and enter your company name, currency symbol, daily sales target, cash floor, and issue tolerance.
- Go to Daily Log and add one row per day: date, sales, cash on hand, tasks due, tasks completed, issues, and a note.
- Return to Settings and choose the Selected Date from the dropdown.
- Open the Dashboard to read the KPI cards and charts.
- Clear the sample rows before you start your own log (the README lists the steps).
Benefits
- One place to look each morning instead of several
- Instant comparison with yesterday, the weekly average, and your targets
- Bad days stand out, along with the note explaining why
- Simple enough to update in a couple of minutes a day
- Works offline in a file you already know how to open
Excel Requirements
The template contains no macros. It is built for modern desktop Excel (Excel 2016 or later, or Microsoft 365) and uses standard functions such as INDEX, MATCH, IF, AVERAGE, and TEXT. It has not been tested in Excel Online or the mobile apps.
Frequently Asked Questions
Does it connect to my point-of-sale or accounting software?
No. All Daily Log figures are typed in by you. The template does not import from or link to other software.
How is the 7-day average calculated?
It averages the current row and the six rows above it. Enter days in date order with no gaps, so it means the last seven days.
Can I look at a past day?
Yes. Choose any logged date in the Selected Date dropdown on Settings, and the Dashboard updates.
How do I add more days?
Type them in the next empty Daily Log rows; formulas are ready to row 507. Then extend the DLDateSample named range and the trend chart range, as described in the README.
What triggers the Attention status?
Sales below your daily target, cash below your cash floor, or more issues than your tolerance.
Is this a monthly KPI dashboard?
No. It is a same-day, short-window check. It does not build monthly or yearly reports.
Can I change the currency?
You can change the symbol used in headings in Settings. Number formats display a dollar sign.

← Previous Article
Free Excel Appointment Scheduler Template with Double-Booking AlertsYou may also like