Free Excel Inventory Management Template for Small Retailers
If you still count stock by hand or keep quantities in scattered spreadsheets, you rarely know what is on the shelf, what it is worth, or what you are about to run out of. Small retailers and product businesses lose sales to stock-outs and tie up cash in slow movers because nobody has a single, reliable view of stock.
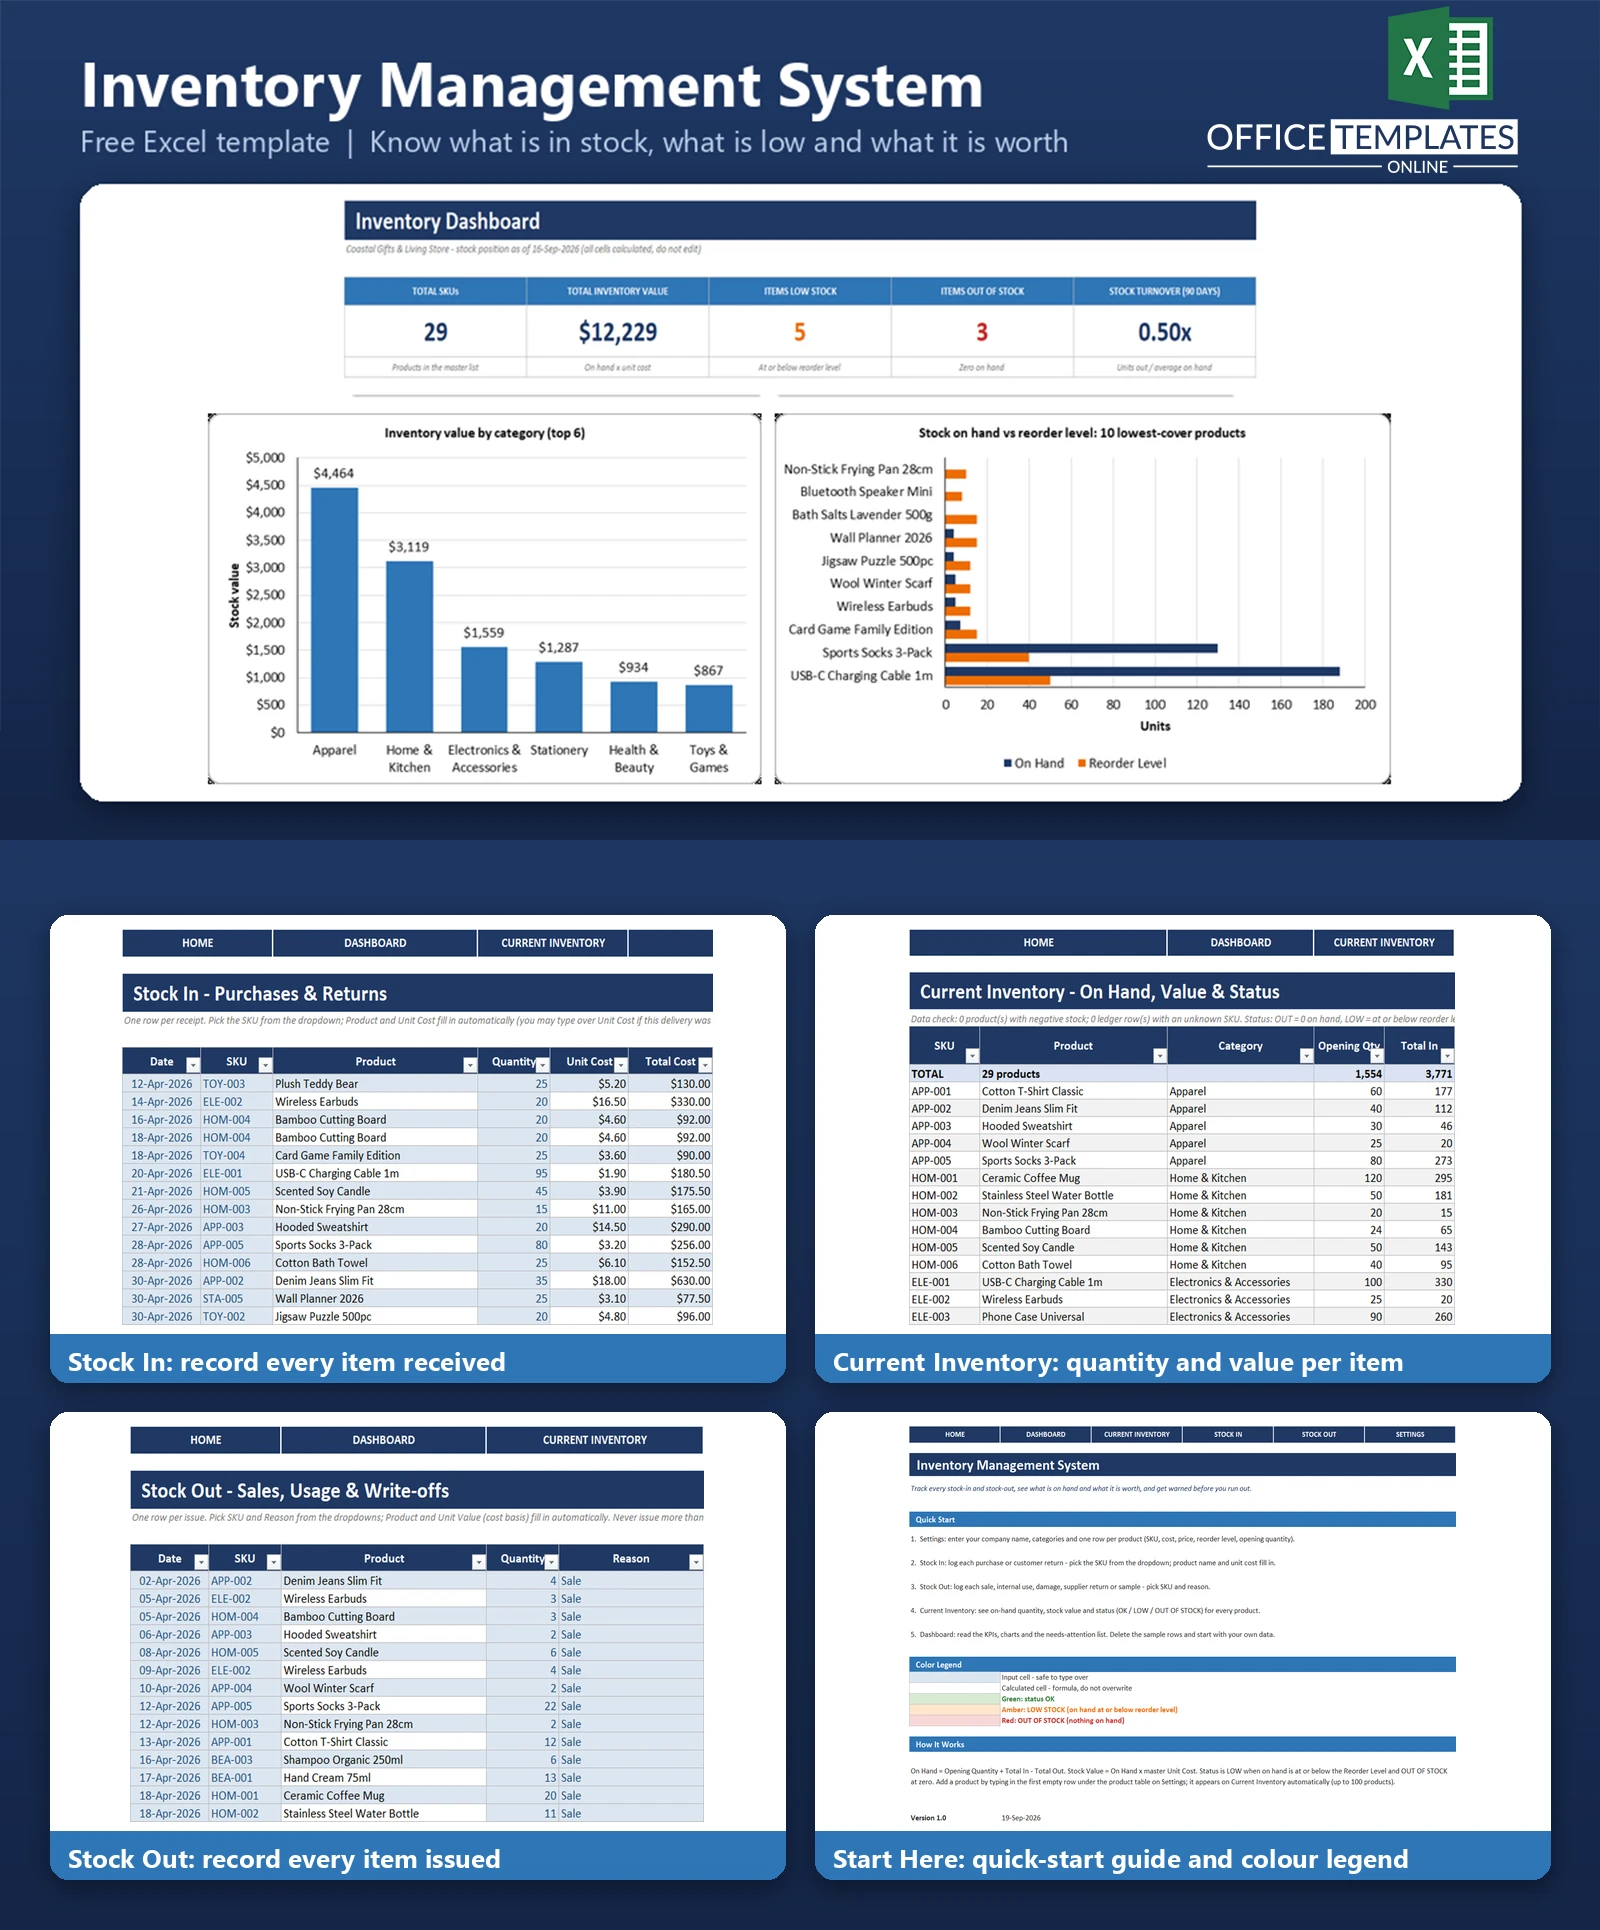
This Excel inventory management template gives you a proper stock ledger. Log every purchase and return on the Stock In sheet and every sale, write-off, or internal use on the Stock Out sheet. The workbook then works out on-hand quantity, stock value, and a status for every product, so you can see at a glance what is fine, what is low, and what is gone.
A Dashboard summarises total SKUs, inventory value, low and out-of-stock counts and stock turnover, with three charts and a needs-attention list. It contains no macros and works in modern desktop Excel. Sample data for a fictional gift and home store is included so you can see everything working before you enter your own products.
Key Features
- Product master in Settings: SKU, name, category, unit of measure, unit cost, selling price, reorder level, and opening quantity
- Stock In and Stock Out ledgers built as Excel Tables with SKU and reason dropdowns.
- Product name and unit cost fill in automatically from the master list
- Current Inventory sheet with total in, total out, on hand, stock value, and last movement date for every product
- Status flags: OUT OF STOCK (red), LOW STOCK (amber) and OK (green) against each product reorder level
- Data check line that flags negative stock or unknown SKUs
- Dashboard with five KPIs, three charts and a needs-attention list
- Room for 100 products; no macros
What You Can Track
- Opening quantity, purchases and customer returns (Stock In)
- Sales, internal use, damaged goods, returns to supplier and samples (Stock Out)
- Quantity on hand and stock value at cost for each product
- Reorder levels and which products have fallen to or below them
- Supplier or reference numbers on every receipt and issue
- Value received and issued per month over the last six months
Dashboard & Reports
The Dashboard opens with five KPI cards: Total SKUs, Total Inventory Value, Items Low Stock, Items Out of Stock, and Stock Turnover (units issued in the last 90 days divided by average on-hand units). Below them are three charts and a list.
- Inventory value by category: a column chart of the six highest-value categories
- Stock on hand vs reorder level: a clustered bar chart of the ten products with the lowest cover
- Monthly stock movement: value received vs value issued for the last six months
- Needs attention: a list of up to ten out-of-stock and low-stock products, lowest cover first
Who Is This Template For
- Small retail shops, boutiques and gift stores
- Online sellers who hold their own stock
- Small wholesalers, workshops and product-based businesses
- Anyone replacing manual stock counts with a simple, auditable ledger
How to Use the Template
- Open Settings and enter your company name, categories, and one row per product with cost, price, reorder level, and opening quantity.
- Record every delivery or customer return on Stock In, picking the SKU from the dropdown.
- Record every sale, write-off, or internal use on Stock Out, choosing the reason.
- Check Current Inventory for on-hand quantities, stock value, and status.
- Review the Dashboard for KPIs, charts, and the needs-attention list, then reorder what is low.
- When you are ready, delete the sample rows and start with your own data.
Benefits
- Know what you have and what it is worth without a manual count
- Spot low and out-of-stock items before customers do
- See which categories hold the most cash
- Keep a dated record of every stock movement
- Simple enough to maintain in a few minutes a day
Excel Requirements
The template is a standard .xlsx workbook for modern desktop Excel (2010 or later, including Microsoft 365). It contains no macros, so there is nothing to enable. It uses long-established functions such as SUMIFS, INDEX, MATCH, SUMPRODUCT, and IFERROR, and does not rely on dynamic arrays.
Frequently Asked Questions
How is quantity on hand calculated?
On-hand equals the opening quantity on Settings plus everything logged on Stock In minus everything logged on Stock Out for that SKU.
How is stock value calculated?
On-hand quantity multiplied by the unit cost in the product master. It is a simple current-cost valuation, not FIFO or average-cost accounting.
How does the low-stock warning work?
A product is LOW STOCK when on hand is at or below its reorder level and OUT OF STOCK when it reaches zero. Each product has its own reorder level.
How do I add a new product?
Type it in the first empty row directly under the product table on Settings. It appears on Current Inventory automatically, up to 100 products.
Can I record customer returns?
Yes. Log them on Stock In with a note. Returns to a supplier go on Stock Out using the Returned to Supplier reason.
How is stock turnover measured?
Units issued in the last 90 days divided by the average of on-hand units 90 days ago and at the as-of date. It is a simplified, unit-based measure.
Are macros required?
No. The workbook contains no macros or add-ins.
How do I remove the sample data?
Delete the sample rows on Stock In, Stock Out, and the product rows on Settings, then enter your own. The README describes the steps.

You may also like