Free Excel Sales Dashboard Template for Small Businesses
If you run a small business, there's a good chance your sales data lives in scattered notebooks, invoices, or a spreadsheet that only tells you what happened last week - not whether this month is on track, which products are actually paying the bills, or which customers matter most. Piecing that picture together by hand takes time you don't have, and it's easy to miss a slow month until it's already over.
This free Excel Sales Dashboard Template solves that by giving you one place to log every sale and one place to see the results. You type each transaction into a single, guided data entry sheet; the dashboard and monthly report calculate everything else automatically - revenue trends, top products, top customers, and progress against your target.
It's built for small business owners, sales managers, and anyone who tracks sales in Excel but doesn't want to build formulas and charts from scratch. No macros, no add-ins, no subscription - just a spreadsheet that works the moment you open it.
Key Features
- A single guided data-entry sheet (Sales Log) built as an Excel Table, so every other sheet updates automatically as you add rows.
- Dropdown lists for Customer Segment, Product, Customer Name, and Sales Rep - type less, enter data more consistently.
- Built-in validation that catches invalid dates and zero or negative quantities and prices before they throw off your numbers.
- Automatic KPIs: Revenue Month-to-Date, Revenue Year-to-Date, Month-over-Month Growth %, Sales Target Attainment %, and Average Order Value.
- Top-5 Products and Top-5 Customers rankings that recalculate as your data changes.
- Four native Excel charts: a 12-month revenue trend, revenue by product, revenue by customer segment, and target vs. actual for the current month.
- A traffic-light status indicator that flags whether you're on track, close, or behind on your monthly target.
- A print-ready Monthly Report with revenue, order count, average order value, and growth % for each of the last 12 months.
- 60+ rows of realistic sample data already filled in, so you can see exactly how it works before entering your own numbers.
What You Can Track
- Total revenue by day, month, and year to date
- Which products generate the most revenue
- Which customers generate the most revenue
- Revenue split across customer segments (Retail, Wholesale, Online, Corporate - or your own categories)
- Number of orders and average order value, month by month
- Progress toward a monthly sales target, updated automatically as sales come in
- Month-over-month growth or decline in revenue
Dashboard & Reports
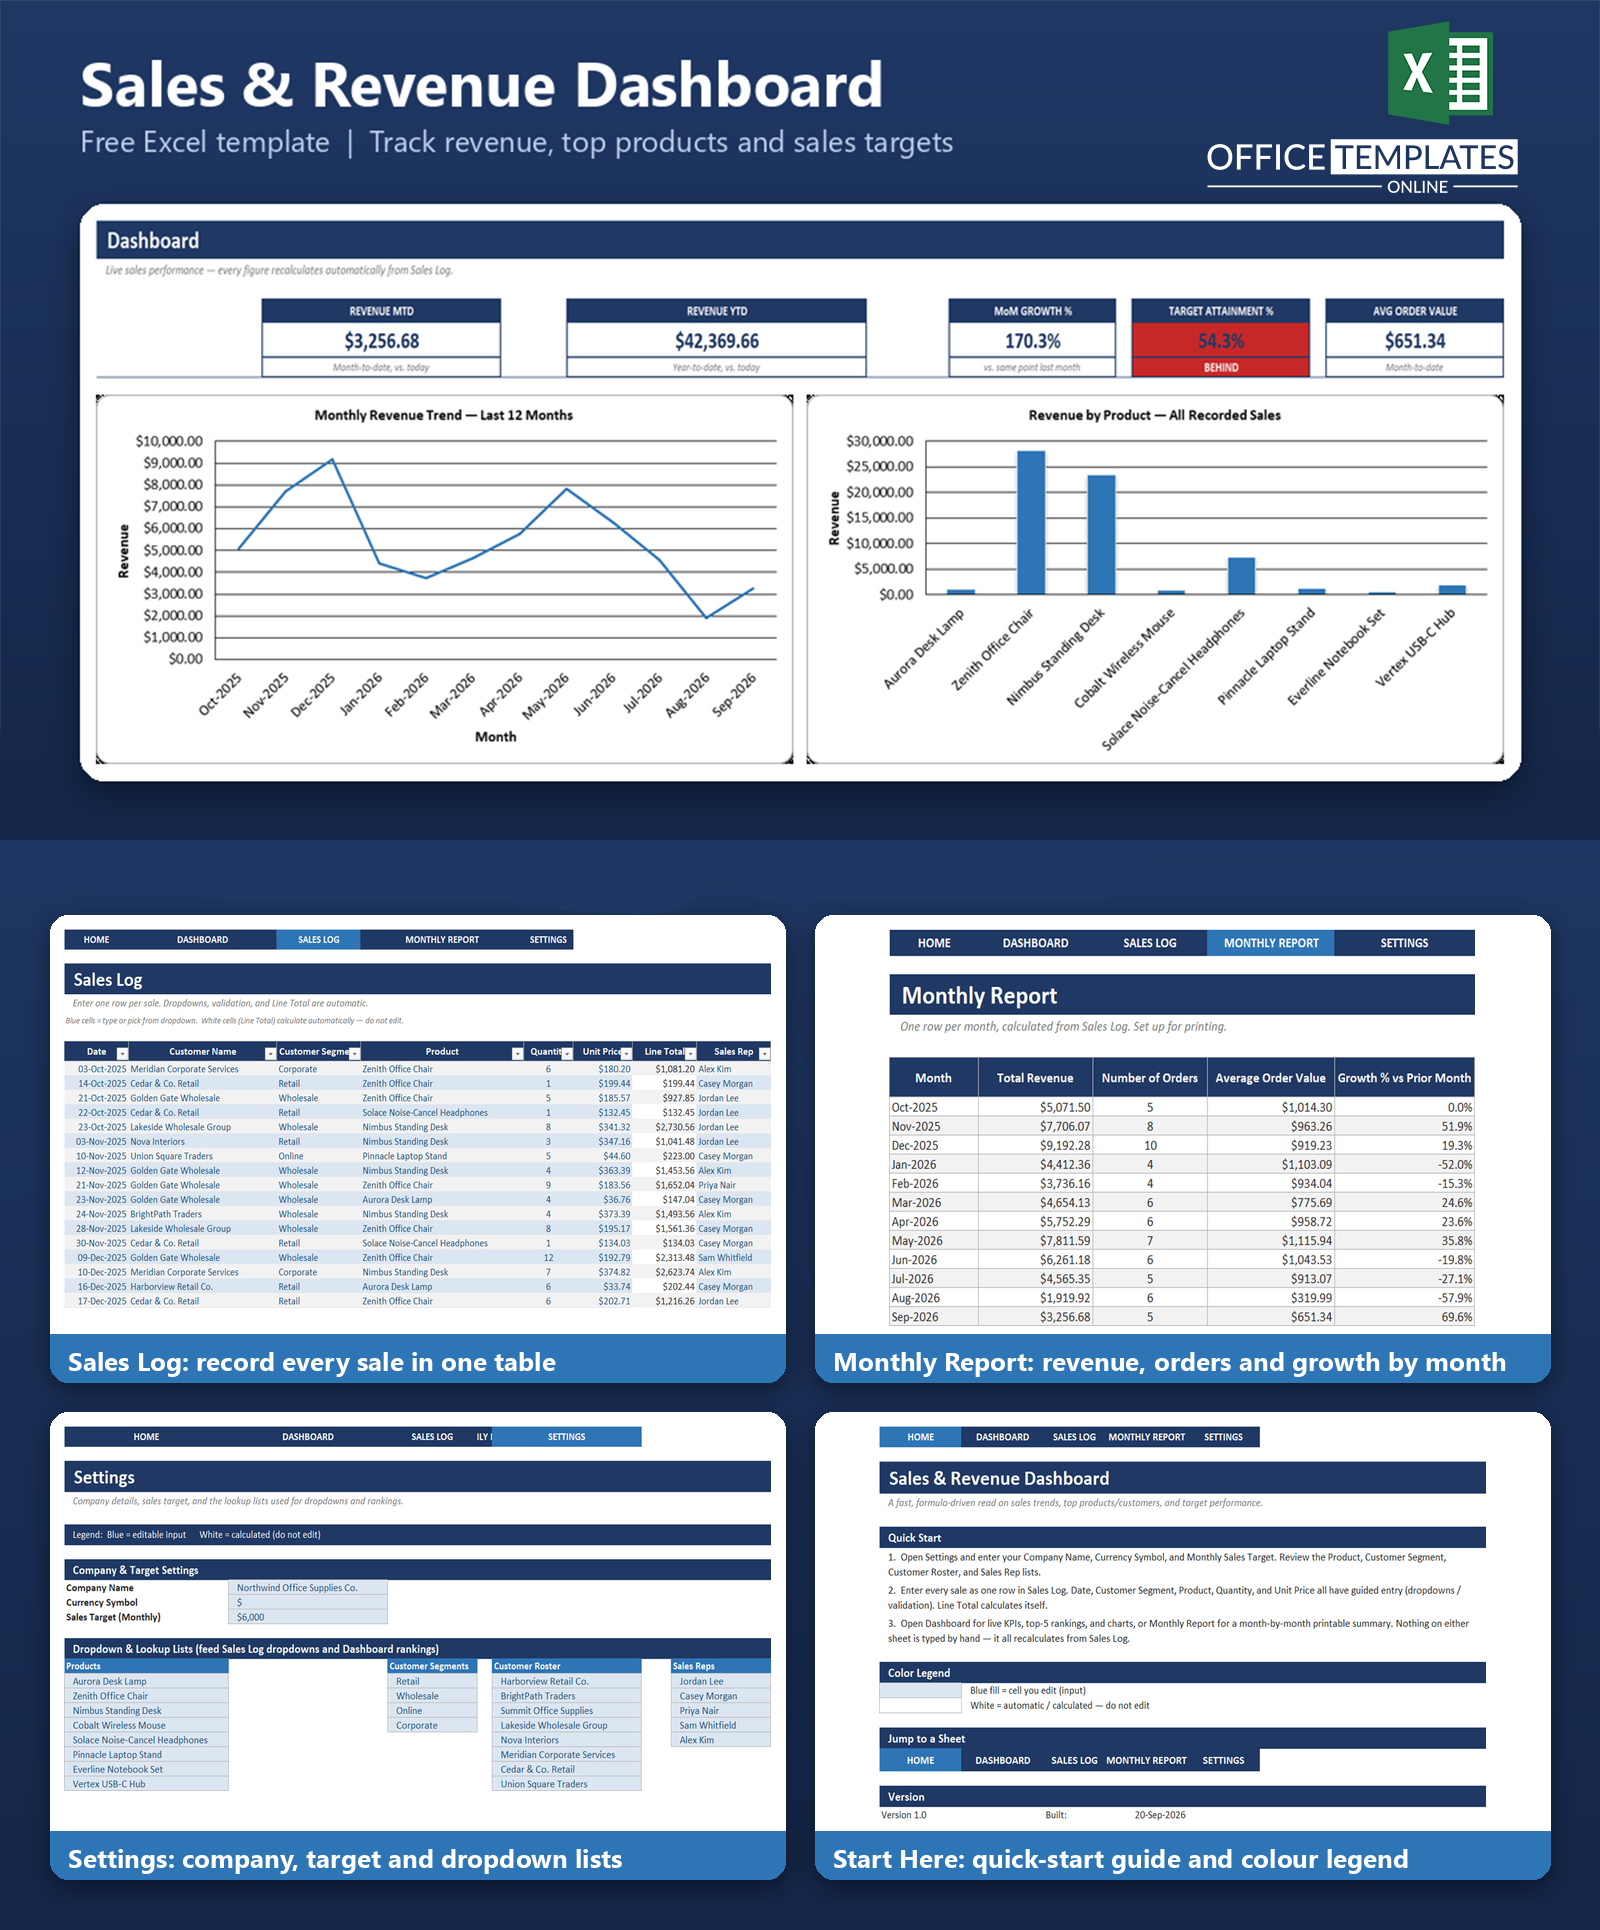
The Dashboard sheet is the heart of the template. Five KPI cards across the top show Revenue MTD, Revenue YTD, MoM Growth %, Sales Target Attainment %, and Average Order Value, all calculated live from your sales log using formulas keyed off today's date - open the file on a different day and the numbers reflect that day automatically.
Below the KPIs, two ranked tables show your Top-5 Products and Top-5 Customers by revenue. Underneath those, four charts give you the visual view: a line chart of monthly revenue over the last 12 months, a bar chart of revenue by product, a segment-by-segment doughnut-style pie chart, and a bar chart comparing your current month's actual revenue to your target. A color-coded status label (green, amber, or red) tells you at a glance whether you're on track.
The Monthly Report sheet lays out one row per month - total revenue, number of orders, average order value, and growth % versus the prior month - formatted and print-area-ready so you can hand a clean one-page summary to a business partner, investor, or your own files.
Who Is This Template For
- A boutique or online shop owner who wants to see which products are actually selling, not just guess.
- A small B2B distributor comparing revenue across Retail, Wholesale, and Corporate accounts.
- A sales manager who reports monthly numbers to an owner or leadership team and wants a clean, consistent format.
- Anyone currently tracking sales in a plain list or notebook who wants dashboards and rankings without learning spreadsheet formulas.
How to Use the Template
- Open the Settings sheet and enter your company name, currency symbol, and monthly sales target.
- Review (and edit if needed) the Product, Customer Segment, Customer Roster, and Sales Rep lists - these power the dropdowns in Sales Log.
- Open Sales Log and enter each sale as one row: date, customer, segment, product, quantity, and unit price. Line Total calculates itself.
- Open Dashboard to see your KPIs, rankings, and charts update automatically.
- Open Monthly Report whenever you need a printable month-by-month summary.
- Delete the sample data and start entering your own sales whenever you're ready - instructions are included in the README that ships with the template.
Benefits
- Save time: stop rebuilding the same pivot tables and charts every month - enter data once and let the formulas do the rest.
- Fewer mistakes: dropdowns and validation reduce typos in customer, product, and segment names, which keeps your totals accurate.
- Better visibility: see revenue trends, top performers, and target progress in one place instead of hunting through raw transaction lists.
- No learning curve for daily use: the color convention (blue = type here, white = calculated) makes it clear where to enter data without reading a manual.
Excel Requirements
This template is a plain .xlsx file with no macros or VBA, so it opens safely with macros disabled and works in modern desktop Excel (Excel 2016 and later, and Microsoft 365). It's built using a native Excel Table, standard formulas (SUMIFS, COUNTIFS, INDEX/MATCH, IFERROR, and similar), data validation dropdowns, conditional formatting, and native Excel charts - not images or add-ins - so everything remains fully editable.
FAQ
Do I need to know Excel formulas to use this?
No. You only type into the Sales Log and Settings sheets. Every formula on the Dashboard and Monthly Report is already built for you.
Will this work in an older version of Excel?
It's designed for modern desktop Excel (2016 or later, and Microsoft 365) and intentionally avoids newer functions that aren't available everywhere, so it stays broadly compatible.
Can I add my own products, customers, or segments?
Yes. Edit the lists on the Settings sheet, and the dropdowns, rankings, and charts on Dashboard update automatically.
How do I remove the sample data and start fresh?
Select the sample rows in Sales Log and delete their contents, then start typing your own data in the row right below the header. Step-by-step instructions are included in the template's README file.
Does it support multiple currencies or locations?
The template is built for a single company and currency. The currency symbol is set once in Settings; multi-location or multi-currency consolidation isn't built in.
Why does my Target Attainment % look low early in the month?
Target Attainment % compares month-to-date revenue against your full monthly target, so it naturally reads lower earlier in the month and rises as more sales come in - that's expected, not an error.
Is there a limit to how many sales I can log?
The Sales Log is a standard Excel Table that expands as you add rows, so you can keep logging sales well beyond the built-in sample data.
Does the file contain any macros or scripts?
No. It's a macro-free .xlsx workbook, so there are no security warnings and nothing to enable when you open it.

← Previous Article
Free Excel CRM Template for Small Businesses and FreelancersYou may also like