Free Excel Project Management Dashboard Template for Small Teams and Agencies
When a small team runs six, ten, or twelve projects at the same time, every project has its own task list, its own budget note, and its own status email. Nobody can answer the simple questions quickly: which projects are in trouble, how far along is each one, and are we spending faster than we are delivering?
This Excel project management dashboard gives agencies, studios, and small delivery teams a portfolio-level view. You list your projects and their milestones, and the workbook calculates each project's percent complete from delivered milestones, compares it with how much of the schedule has elapsed, checks spend against progress, and labels every active project On Track, At Risk, or Late.
It is built for portfolio oversight rather than individual task lists. Everything runs on standard formulas and dropdowns in desktop Excel, with no macros and no add-ins.
Key Features
- Projects table with client, type, manager, dates, status, budget, and spend to date.
- Milestones table with due date, completed date and a weight for each milestone.
- Percent complete calculated automatically from weighted completed milestones.
- Health (RAG) status for active projects: On Track, At Risk, or Late, using rules you can tune in Settings.
- Budget flag (OK, Watch, Over Budget) that compares spend percentage with percent complete.
- As-of Date setting so status is measured on a fixed date, or on today's date if you enter =TODAY().
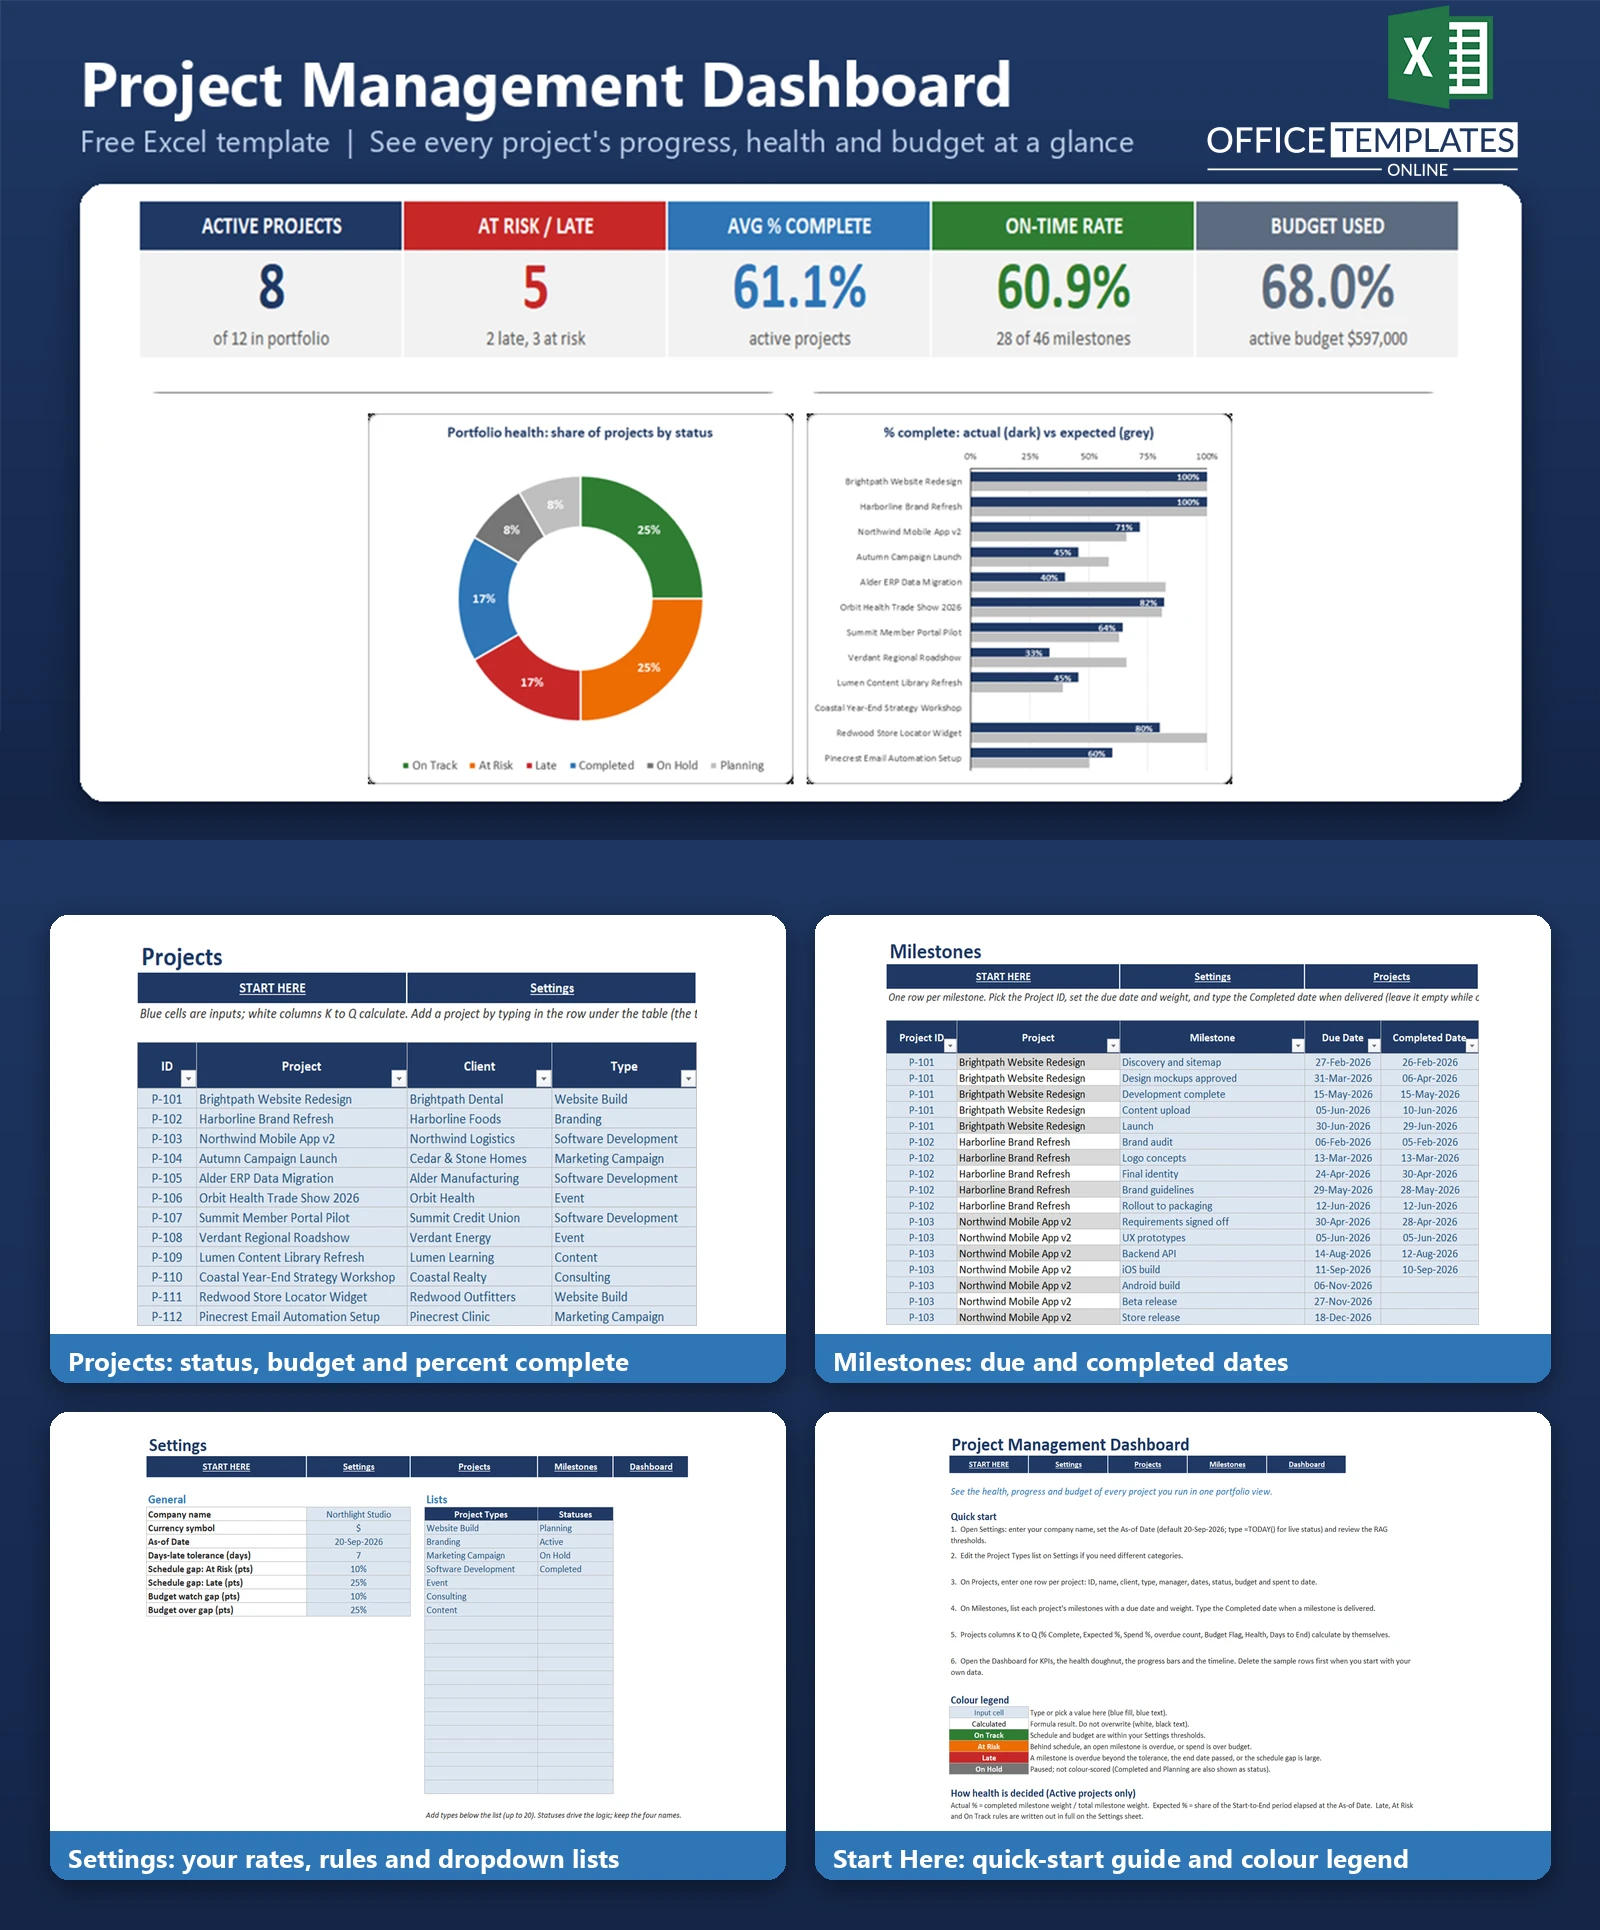
- Dashboard with five KPI cards and three charts: a health doughnut, an actual-versus-expected progress bar chart, and a Gantt-style timeline.
What You Can Track
- Twelve sample projects across website, branding, marketing, software, event, content, and consulting work (room for 200 rows).
- Sixty-nine sample milestones with due dates, completion dates and weights (room for 500 rows).
- Budget and spend to date for each project.
- Statuses: Planning, Active, On Hold, and Completed, and an editable list of project types.
Dashboard & Reports
The Dashboard shows Active Projects, At Risk/Late, Avg % Complete for active projects, On-Time Rate for milestones, and Budget Used across active projects. Below the KPI cards, a doughnut chart shows the share of projects by health status, and a bar chart compares actual percent complete with the percent expected from elapsed time for every project.
A Gantt-style timeline runs across the full width. Each bar spans a project's start to end date, with the completed portion in dark blue and the remainder in light blue. The Projects sheet adds colour-coded Health and Budget Flag columns, and the Milestones sheet marks each milestone as Done On Time, Done Late, Overdue or Open.
Who Is This Template For
- Agency owners and studio managers running several client projects at once.
- Project managers and delivery leads who report status to management.
- Small IT, marketing, and event teams that need a portfolio view without a full PM platform.
- Consultants and freelancers who manage multiple engagements.
How to Use the Template
- Open Settings, enter your company name, and review the As-of Date and the RAG thresholds.
- Adjust the project type list if needed.
- Add each project on the Projects sheet with dates, status, budget, and spend.
- List each project's milestones on the Milestones sheet with a due date and weight.
- Type a Completed date when a milestone is delivered, and update spend to date as it changes.
- Open the Dashboard to see health, progress, and the timeline. Delete the sample rows first when you begin with your own data.
Benefits
- One view of every project instead of separate lists and emails.
- Problems show up early: overdue milestones and overspend are flagged automatically.
- Progress is based on delivered milestones, not on opinion.
- Clear rules: the exact Late and At Risk logic is written out on the Settings sheet.
- Flexible: change tolerances, types, and the reporting date to suit your team.
Excel Requirements
The workbook contains no macros and works in modern desktop Excel for Windows or Mac. It uses standard functions such as SUMIFS, COUNTIFS, AVERAGEIFS, INDEX, MATCH, IF, and TEXT.
Frequently Asked Questions
How is percent complete calculated?
It is the total weight of milestones that have a Completed date divided by the total weight of all milestones for that project. A milestone with weight 3 counts three times as much as one with weight 1.
What makes a project Late or At Risk?
A project is Late if an open milestone is overdue by more than the tolerance (7 days by default), the end date has passed before it reaches 100 percent, or it trails the expected schedule by 25 points or more. It is At Risk if it trails by 10 points or more, any open milestone is overdue, or spend is over budget. Otherwise, it is On Track. Only Active projects get a colour.
Can the dashboard use today's date?
Yes. The As-of Date on Settings defaults to 20-Sep-2026, so the sample data looks right. Type =TODAY() in that cell to make every status live.
How many projects does the timeline show?
The charts show the first 12 projects on the Projects sheet. The tables and KPIs cover up to 200 projects and 500 milestones.
Does the timeline work for years other than 2026?
The timeline axis is set to calendar 2026. For another year, change the axis minimum and maximum in Format Axis; the note under the chart explains how.
Do I need macros or add-ins?
No. Everything uses formulas, tables and dropdowns.
How do I add a new project?
Type it in the row under the Projects table so the table extends, then copy the calculated columns K to Q from the row above. Add its milestones on the Milestones sheet using the same Project ID.
How do I remove the sample data?
Clear the blue input cells in the Projects and Milestones tables, keep the formula columns, and delete the extra rows if you wish.