Data Analytics Services Proposal Template with Dashboard Cover
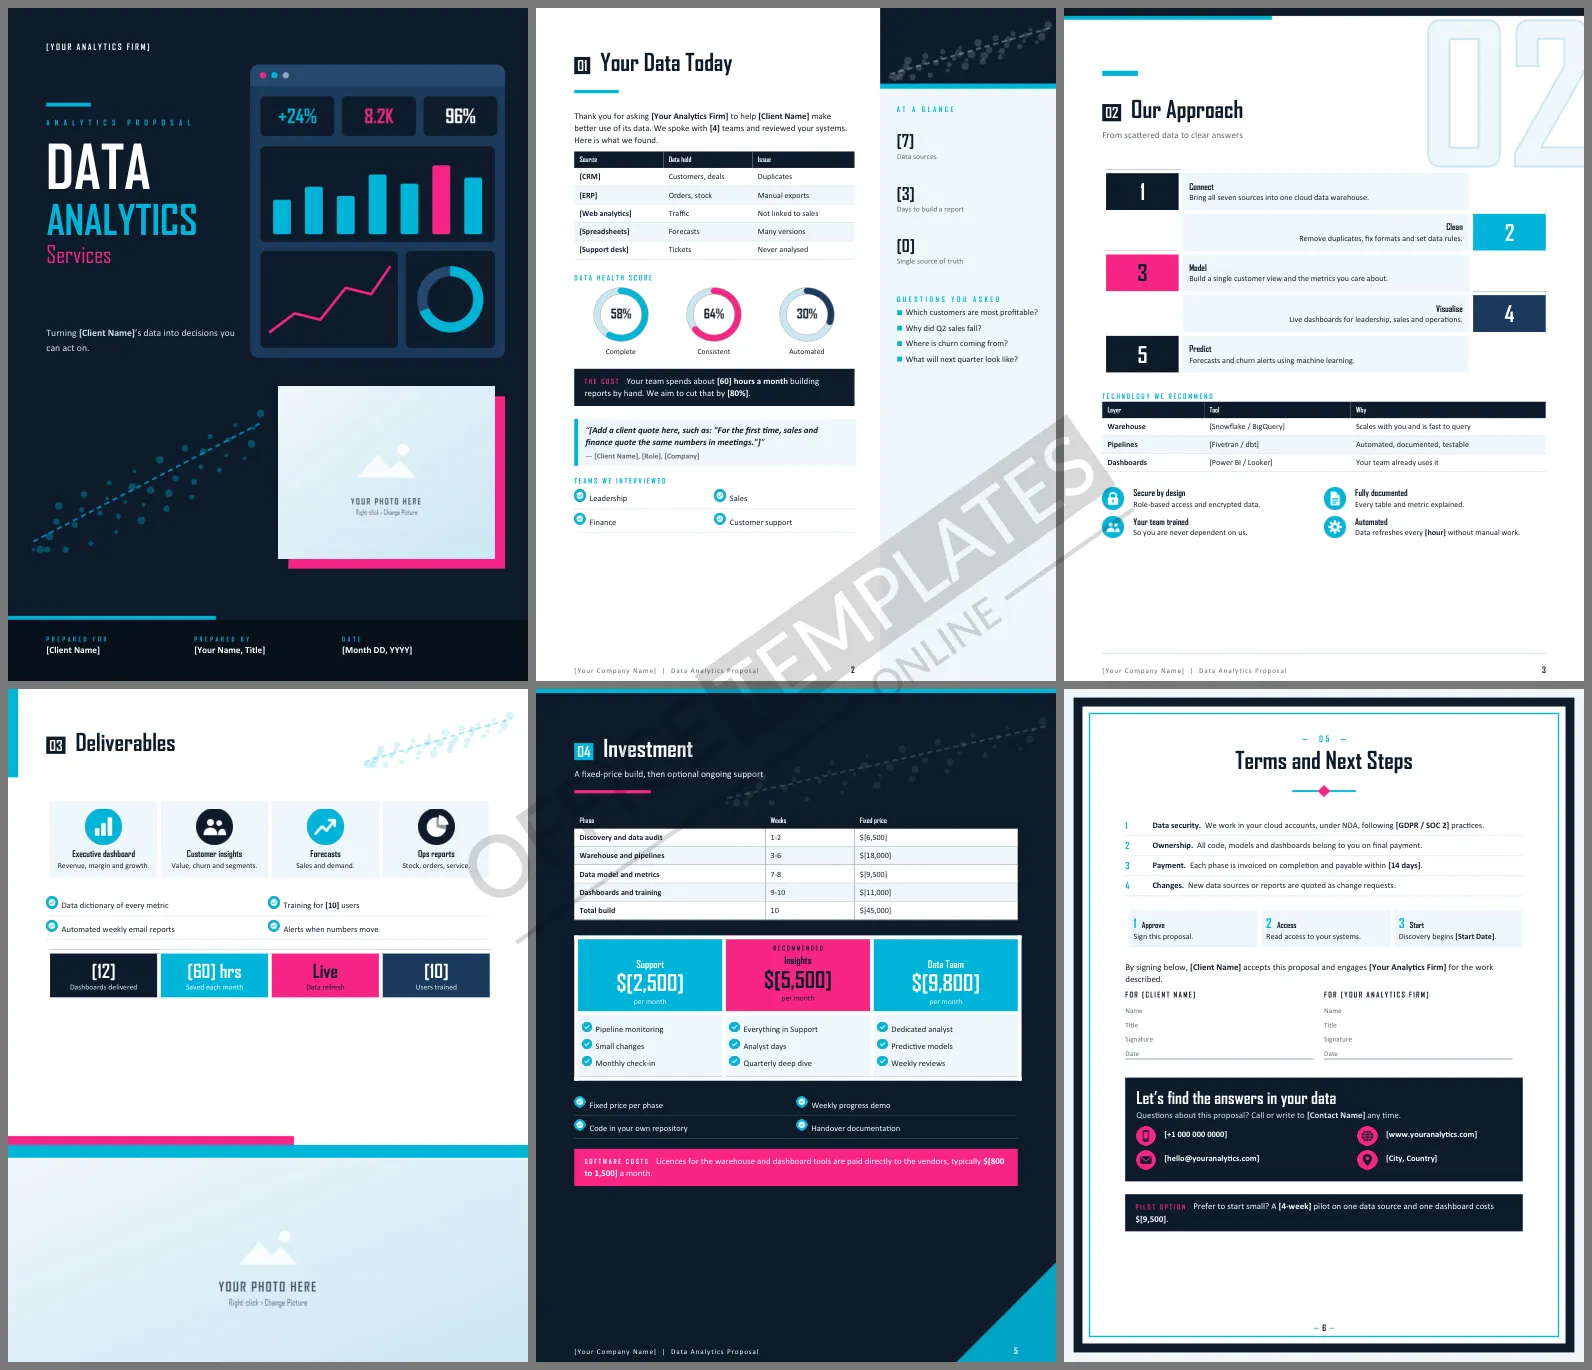
Most companies have plenty of data and very few answers. Reports are built by hand, teams argue over whose numbers are right, and nobody trusts the forecast. A Data Analytics Proposal has to show you understand that frustration and have a clear path out of it. This template gives analytics consultants and data teams six sharp Word pages built around a glowing dashboard.
What the Six Pages Show
The midnight-blue cover features a dashboard window with three KPI tiles, a cyan bar chart with one magenta bar, a line chart and a donut, beside a scatter plot and a magenta-framed photo. Your Data Today lists each data source, what it holds and its main issue, then three data health rings and a callout on hours lost to manual reporting, with a sidebar of the questions the client asked. Our Approach shows five steps in zig-zag rows: connect, clean, model, visualize, and predict, plus a recommended technology table. Deliverables use four dashboard tiles and outcome figures above a wide photo. Investment is a dark page with fixed-price phases and three support plans. A framed closing page holds terms and a contact panel.
Midnight, Cyan and Magenta
The palette mirrors a modern analytics dashboard: dark backgrounds with bright cyan and magenta data colors. Scatter dots and a trend line repeat in the headers. Headings use Agency FB, a narrow technical typeface, with Calibri for readable body text.
A Simple Data Maturity Check
Help the client see where they stand today and where the project will take them:
| Level | What it looks like | After this project |
| Manual | Spreadsheets emailed around | Retired |
| Reporting | Scheduled reports from one system | Automated across all systems |
| Insight | Shared dashboards with agreed metrics | In place by week 10 |
| Prediction | Forecasts and alerts | Available on the Insights plan |
Start with Their Questions, Not Your Tools
Executives do not buy warehouses and pipelines; they buy answers to questions like which customers are most profitable or why sales fell. The sidebar on the first inside page lists those questions in the client's words. Refer back to them on the deliverables page so every dashboard clearly answers something they asked.
Fixed Phases Reduce Risk
Data projects have a reputation for running over. Pricing each phase as a fixed fee, with a weekly demo, gives the client control. The template also offers a smaller pilot on one source and one dashboard for organizations that want to test the relationship first.
Updating Sources and Tools
Swap the bold [placeholders] for the client's systems, issues, tools, and prices. Add rows for extra data sources or phases. Click the cover photo or the photo on the deliverables page and choose Change Picture to show a real dashboard you have built.
Analytics Consultant FAQs
Can I use it for a one-off analysis?
Yes. Delete the build phases and price a single analysis with a findings report.
Does it cover data security?
The terms state that you work in the client's cloud accounts under an NDA, with the standard named in brackets.