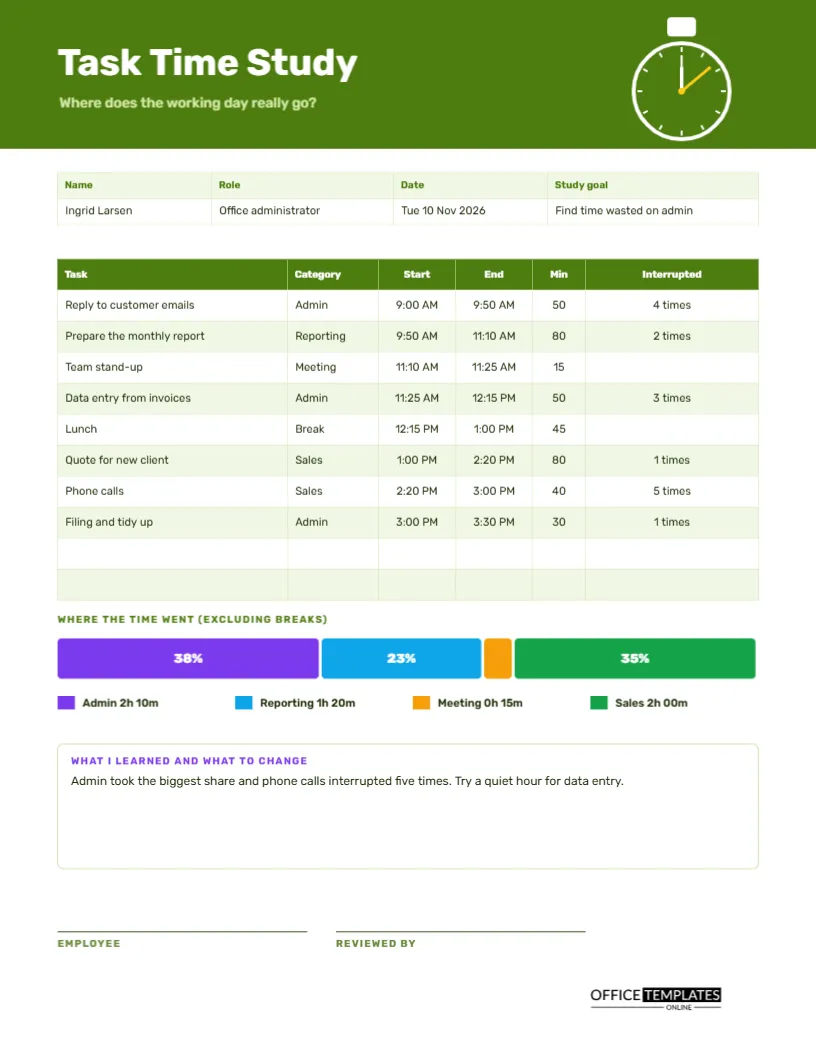
Most people believe they know where their day goes. Most are wrong. A time study is a simple experiment: for one day, write down what you do and when, then look at the pattern. The result is usually a surprise. Email takes twice as long as expected, the phone interrupts the deep work, and lunch is the only quiet hour. This US Letter log gives structure to the experiment, with minutes per task, interruptions, and a bar that shows where the time went.
A Stopwatch in a Lime Green Header
The top band is deep lime green, with a white stopwatch at the right. A small button sits on top of it; the dial has a bright yellow hand and a white ring. The title Task Time Study is set in Rubik, and the question beneath it asks where the working day really goes. The stopwatch makes the purpose clear before any words are read.
Name, Role, Date and Study Goal
The strip holds the name, role, date and study goal. The sample belongs to Ingrid Larsen, an office administrator, on Tuesday 10 November 2026, to find time wasted on admin. Writing a goal stops the study from becoming a pile of data with no question behind it, and helps the reader interpret the results.
Eight Tasks Through the Day
| Task | Category | Minutes | Interrupted |
|---|---|---|---|
| Reply to customer emails | Admin | 50 | 4 times |
| Prepare the monthly report | Reporting | 80 | 2 times |
| Team stand-up | Meeting | 15 | None |
| Data entry from invoices | Admin | 50 | 3 times |
| Lunch | Break | 45 | None |
| Quote for new client | Sales | 80 | 1 time |
| Phone calls | Sales | 40 | 5 times |
| Filing and tidy up | Admin | 30 | 1 time |
The real page also shows start and end times, so the day can be read from nine to half past three.
Categories Make Patterns Visible
One task is an anecdote, but a category is a pattern. By tagging each task as Admin, Reporting, Meeting, Sales, or Break, the study can show how much of the day went to each type of work. Choose four or five categories that match your job, and keep them fixed through the study. Too many categories blur the picture.
Counting Interruptions
The Interrupted column records how many times each task was interrupted. In the sample, phone calls were interrupted five times, and customer email replies four. Interruptions break concentration, and recovering from each can cost far more time than the interruption itself. A tally of them is often the most persuasive number in the whole study.
Where the Time Went Bar
Beneath the table, a single long bar splits into coloured segments, one for each category except breaks. Admin takes 38 percent, Reporting 23 percent, Meetings 4 percent, and Sales 35 percent. A legend underneath gives the actual time for each, such as Admin 2h 10m. The picture shows in one glance what a list of numbers hides.
What I Learned and What to Change
A notes box turns data into decisions. The sample reads: admin took the biggest share, and phone calls interrupted five times; try a quiet hour for data entry. A good study ends with one or two experiments, not a long list of resolutions. Pick the change that is easiest to try and measure it in a second study next month.
Running the Study in Five Steps
- Choose a normal day and a clear goal.
- Note the start time whenever you change tasks.
- Tag the category and tally interruptions as they happen.
- At the end of the day, work out minutes for each task.
- Add the categories and draw the bar.
- Write what you learned and one change to test.
Honesty Beats Perfection
The study works only if you record what really happened. If you spent twenty minutes reading news, write it down under a category such as Other. No one is judging you, and the data belongs to you. An honest study with a few rough patches teaches far more than a polished one that hides the truth.
Studying a Team Process
The same page can study a process instead of a person. Pick a task, such as processing an order, and have a few staff log the steps and times. Compare the logs to find where delays occur. Process studies often reveal handover waits and duplicated checks that no one noticed before.
Repeating the Study After a Change
After you try a change, run the study again on a similar day. Compare the bar charts. If the admin share fell and interruptions dropped, the change worked. If not, try another. Repeated small studies are a cheap way to improve the way you work, and the pages become a record of your progress.
Respecting Privacy in Time Studies
If a manager asks staff to run a study, explain the purpose and how the results will be used. A study framed as support is far more accurate than one that feels like surveillance. Let people see their own pages, and share only the overall results unless they choose to share more.
Editing Tasks, Categories and Bar
All text is editable, and the table is a real Table object. The coloured bar is made from rectangles, so resize each to match your percentages. Change the category names and colours in the legend to suit your work. Retype the notes, and replace the stopwatch with your own logo if you wish.
Sign-off by the Employee and a Reviewer
The employee and the reviewer sign at the foot. Print the page on US Letter, in colour for the bar, though the segments remain distinct in grayscale because each shows its percentage.
Turning Study Findings Into Small Experiments
Choose one change from the study and test it for two weeks. If admin was the largest share, batch your email into two set times. If calls interrupted deep work, try a call window after lunch. Measure again with a second page, and keep the change only if the numbers move in the right direction.
Time Study Questions
How long should a study run?
One full day is a good start. A week gives a firmer picture, with one page per day.
Can I record in smaller steps?
Yes. The daily time-blocking log in this collection uses fifteen-minute steps.
Do the percentages calculate themselves?
No. Divide each category by the total work minutes and retype the numbers.