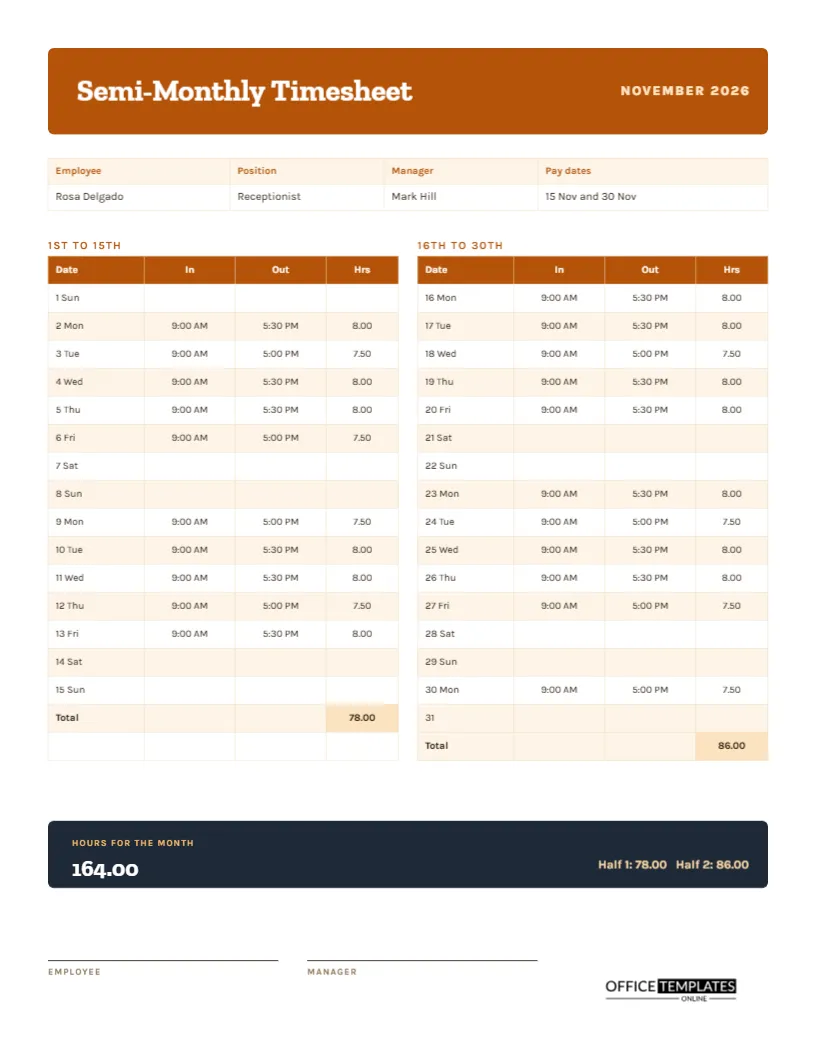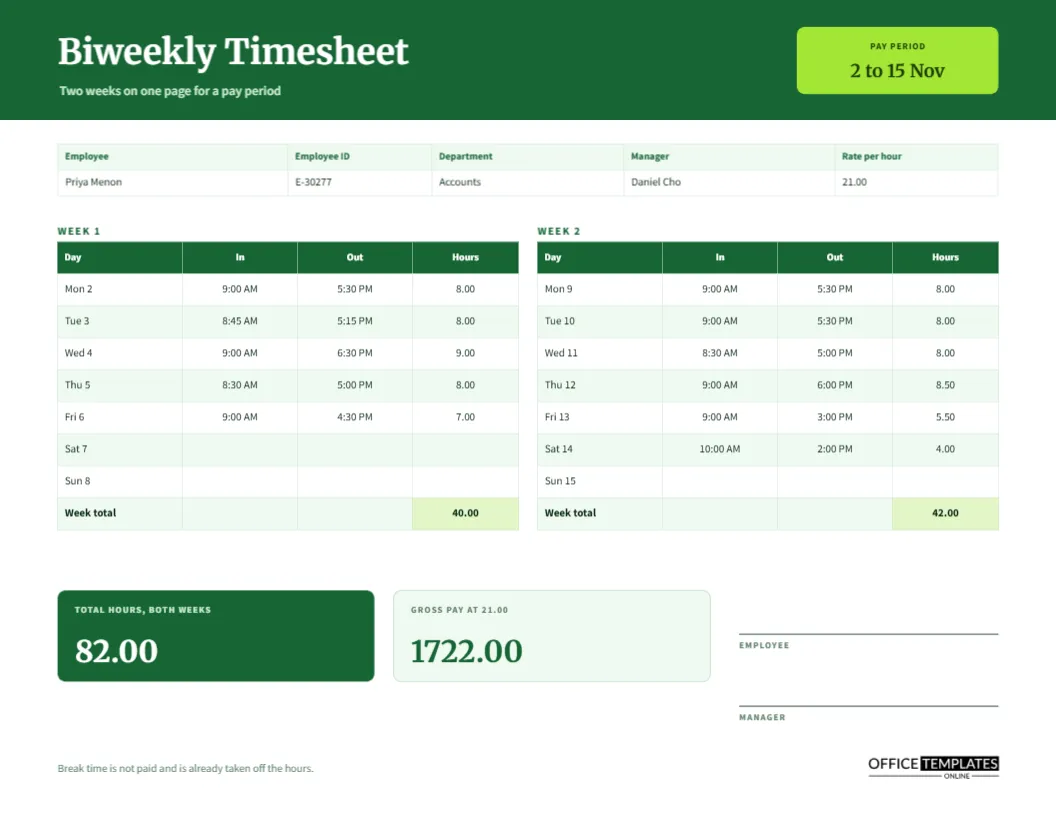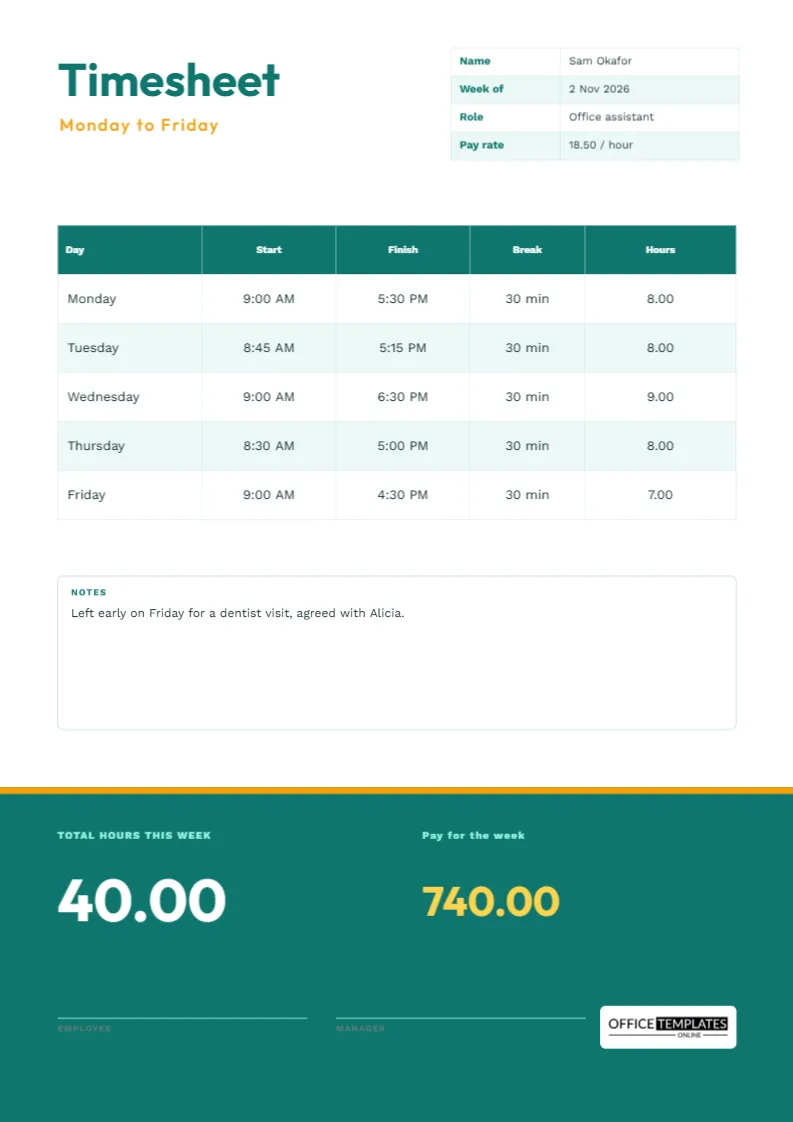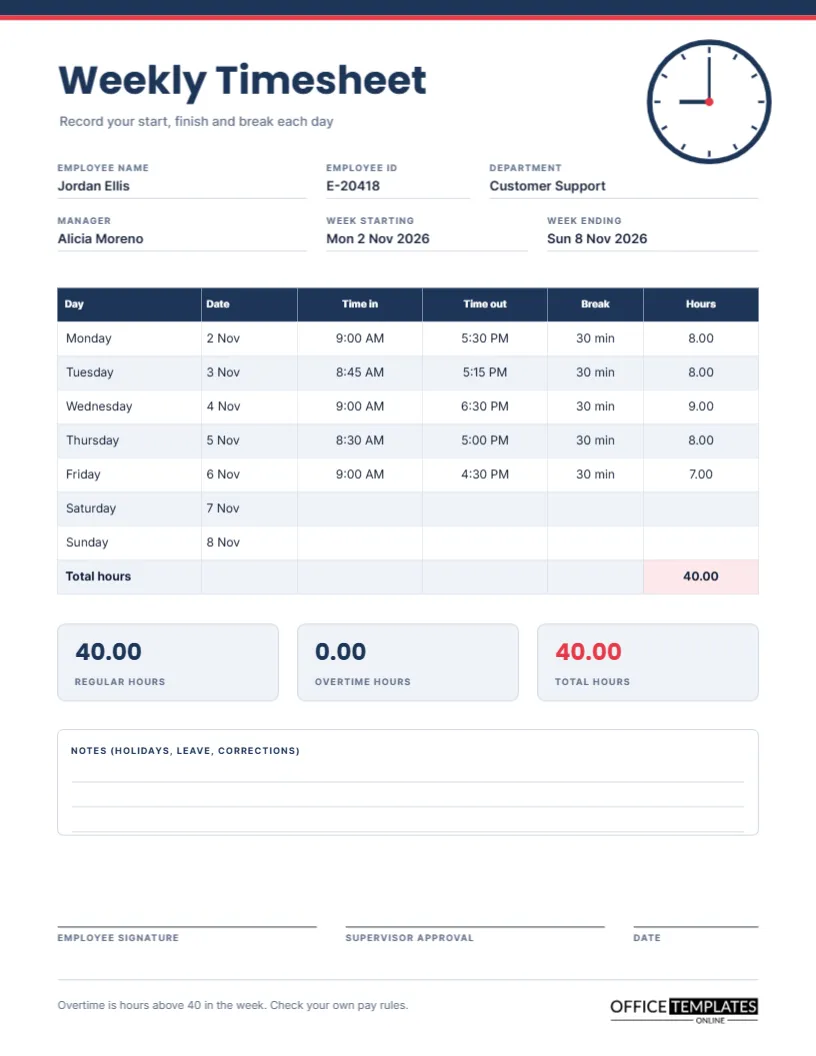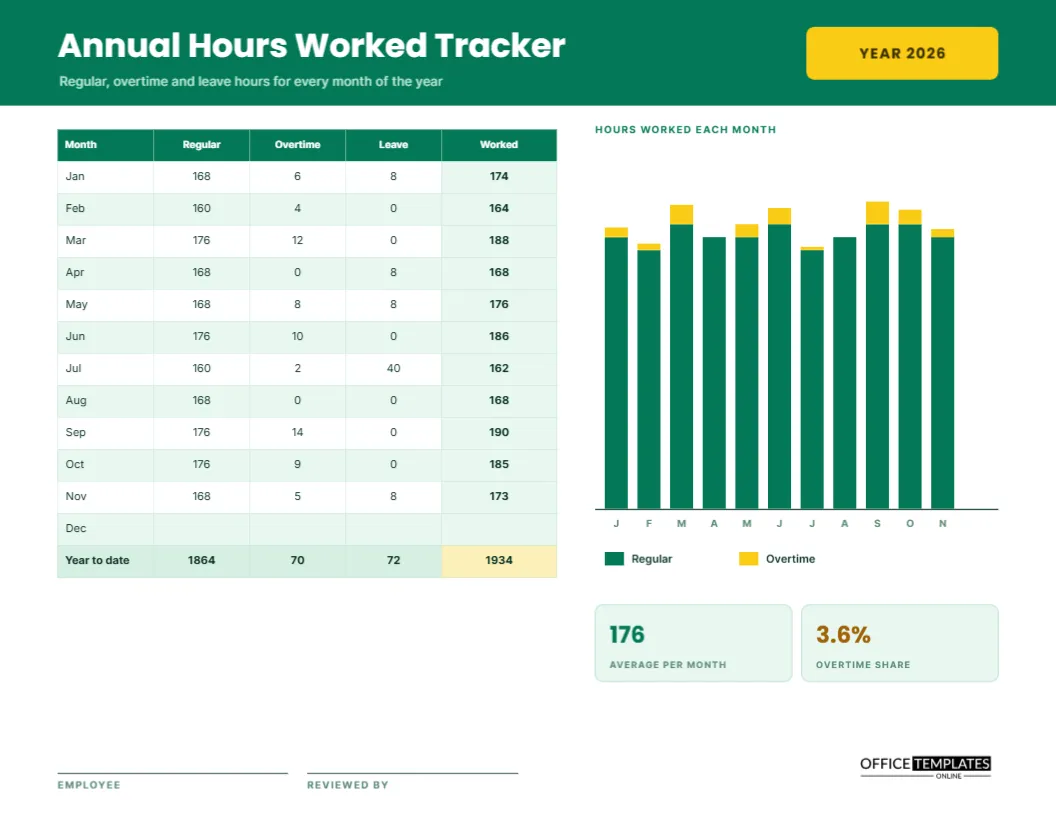
Weekly timesheets answer a weekly question. Sooner or later, someone asks a bigger one. How many hours did I actually work this year? How much of it was overtime? How many hours of leave did I take? An annual tracker answers all three on one page. It lists the twelve months, adds regular, overtime, and leave hours for each, shows the total worked, and draws a small bar chart so the shape of the year is visible at a glance.
Emerald Header With a Gold Year Tab
The page opens with a band of deep emerald and the title Annual Hours Worked Tracker in white Poppins. A gold tab on the right reads YEAR 2026. A short line below the title says regular, overtime, and leave hours for every month of the year. Inter sets the table and labels in a clean, neutral style that stays legible at small sizes.
The Monthly Table
| Month | Regular | Overtime | Leave | Worked |
|---|---|---|---|---|
| January | 168 | 6 | 8 | 174 |
| February | 160 | 4 | 0 | 164 |
| March | 176 | 12 | 0 | 188 |
| April | 168 | 0 | 8 | 168 |
| May | 168 | 8 | 8 | 176 |
| June | 176 | 10 | 0 | 186 |
| July | 160 | 2 | 40 | 162 |
| August | 168 | 0 | 0 | 168 |
| September | 176 | 14 | 0 | 190 |
| October | 176 | 9 | 0 | 185 |
| November | 168 | 5 | 8 | 173 |
December is left blank because the year is not over, and the real page has a shaded totals row.
What Worked Means Here
The Worked column adds regular and overtime hours. Leave is shown separately and is not added, since it is paid time away from work, not time worked. If your organisation counts leave as hours worked for a particular purpose, such as a benefits threshold, retype the column heading and add leave to the formula. Whatever you choose, explain it in a note.
Totals for Regular, Overtime, Leave and Worked Hours
A shaded row sums the columns: 1864 regular hours, 70 overtime hours, 72 leave hours, and 1934 hours worked. The last cell is highlighted in gold because it is the number most often quoted. If you are tracking toward a contract target, such as 2000 hours a year, compare this cell with the target and divide to see what pace you need for the rest of the year.
The Bar Chart
To the right of the table, a bar chart shows each month as a green column with a gold section on top for overtime. The letters J, F, M, and so on sit beneath the bars. At a glance, you can see that March, June, and September were heavy, and that July dipped for a summer holiday. The bars are shapes drawn to scale, so adjust them by dragging if you change a figure.
Two Summary Tiles
Below the chart, two tiles give the average per month (176 hours) and the overtime share (3.6 percent). The average divides hours worked by the eleven months completed, not by twelve. The overtime share is overtime divided by hours worked. If it starts to climb well above a few percent, it is a sign that the team is stretched or that staffing needs review.
Who Needs an Annual Hours Tracker
Employees on annualised hours contracts, freelancers who want to know their real workload, managers monitoring a team member’s pace, and anyone applying for something that requires proof of hours all benefit. It is also useful for people with an hours threshold to cross, such as for a benefit, a licence renewal, or a student placement.
Filling in the Tracker Each Month
- At month-end, add up your regular hours from the weekly sheets.
- Add the overtime hours separately.
- Add any hours of leave taken.
- Write regular plus overtime in the Worked column.
- Update the year-to-date row and the two tiles.
- Add or lengthen the bar for the month.
Using the Tracker in a Pay or Contract Review
At a review, the tracker gives a factual basis for a conversation. If your contract expects 1900 hours and you worked 1934, you can say so with confidence. If you are consistently above, you can argue for a raise or extra time off. If below, you can plan how to catch up before the year ends.
Combining Weekly Sheets Into Monthly Figures
If your weeks cross month boundaries, decide whether to split the week or assign it entirely to one month. The simplest method is to assign it to the month where the week ends. Whatever you choose, apply it all year, so that the totals add up to the same number as the sum of your weekly sheets.
Keeping Leave Hours in a Separate Column
Showing leave on its own line helps you see how much rest you took. The sample has one big dip in July for a holiday, and a few single days in other months. A year with no leave column filled in is a warning sign for burnout, as much for the employer as for the employee.
Editing the Table, Chart and Year
All text is editable, and the table is a real Table object. For a new year, retype the year tab and clear the numbers. Delete the chart if you prefer a plainer page. If you work a different pattern, change the months to periods or add a thirteenth row for a financial year end.
Employee and Reviewer Signatures
Lines for the employee and the reviewer sit at the foot. Print on US Letter landscape at actual size, and keep the signed copy with your annual records. In black and white, the green bars print as dark grey and the gold overtime sections as light grey.
Spotting Seasonal Patterns in Your Own Year
After a full year, look at the bar chart for peaks and dips. A heavy spring, a quiet midsummer and a busy autumn may repeat the following year. Knowing this in advance lets you book leave in the quiet months, plan hiring before the peaks, and set a fair target for overtime.
Annual Hours Tracker Questions
Can I use it for a financial year?
Yes. Retype the month names to start in April or July.
Does it include public holidays?
Count them as leave or as worked hours, whichever your contract specifies, and note the rule.
Do the chart and totals update by themselves?
No. The chart is drawn by hand, and the totals are typed text.