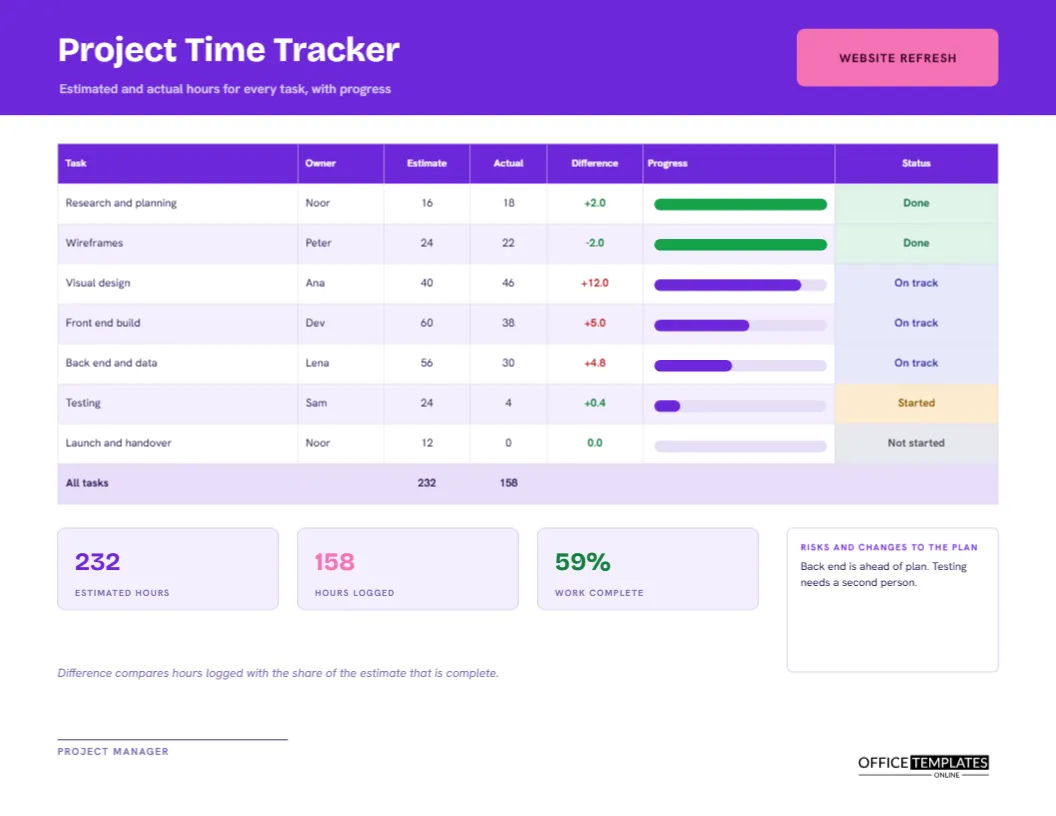
Every project starts with a guess. How many hours will the research, the design, the build, and the testing take? A few weeks later, the guesses meet reality, and the difference decides whether the project makes money or loses it. A task tracker keeps both numbers in front of you. This landscape page lists each task with an estimate, the hours logged so far, the percentage complete, a status, and a measure of whether the task is running over or under.
A Violet Header With a Pink Project Tab
The header is vivid violet, with the title Project Time Tracker in Bricolage Grotesque, a typeface with lively, slightly quirky forms. A pink tab on the right reads WEBSITE REFRESH, the sample project. Beneath the title, a line says estimated and actual hours for every task, with progress. Hanken Grotesk sets the table text in a neat, modern manner.
Seven Tasks, Seven Stories
| Task | Owner | Estimate | Actual | Progress |
|---|---|---|---|---|
| Research and planning | Noor | 16 | 18 | 100% |
| Wireframes | Peter | 24 | 22 | 100% |
| Visual design | Ana | 40 | 46 | 85% |
| Front-end build | Dev | 60 | 38 | 55% |
| Back end and data | Lena | 56 | 30 | 45% |
| Testing | Sam | 24 | 4 | 15% |
| Launch and handover | Noor | 12 | 0 | 0% |
The totals row shows 232 estimated hours and 158 hours logged.
Progress Bars Inside the Table
A column of thin bars sits within the table, one for each task, filled to the percentage complete. Finished tasks are green, and the rest are violet. The bars are drawn shapes placed over the table, so they can be dragged to new lengths when progress changes. A glance down the column tells the story of the project in a moment.
Task Status Labels From Done to Not Started
The last column carries a coloured pill for each task: green Done, indigo On track, amber Started, and grey Not started. Statuses should follow clear rules. In the sample, 100 percent is Done, 40 percent or more is On track, anything above zero is Started, and zero is Not started. Agree on your own rules with the team so that the labels mean the same to everyone.
What the Difference Column Measures
The Difference column compares hours logged with the share of the estimate that the task should have used at its current progress. Visual design is 85 percent complete, so it should have used about 34 of its 40 hours. It has logged 46, a difference of plus 12.0, shown in red. Wireframes are done in 22 of 24 hours, a difference of minus 2.0, shown in green.
Why Difference Is Better Than a Simple Comparison
Comparing actual hours with the full estimate is misleading for unfinished tasks. Front-end build has used 38 of 60 hours, which sounds fine, but it is only 55 percent done, so it should have used 33. The difference of plus 5.0 shows it is slightly over pace. This method warns you early, while there is still time to adjust scope or add help.
Estimated Hours, Hours Logged and Work Complete Tiles
Under the table, tiles report estimated hours (232), hours logged (158), and work complete (59 percent). The last figure weights each task by its estimate: add the estimate times the progress for every task and divide by the total estimate. It is a fairer measure of completion than a plain average of percentages, which treats a small task and a large one the same.
Risks and Changes to the Plan
A box on the right is for risks and changes. The sample says the back end is ahead of plan and testing needs a second person. Use this space to explain any red numbers, to propose moving hours between tasks, and to flag what will need a decision. A tracker with notes is a management tool, and a tracker without them is only a scoreboard.
Updating the Tracker Weekly
- Copy the hours logged for each task from the team timesheets.
- Ask each owner for an honest percentage complete.
- Resize each progress bar to match.
- Work out the difference for each task.
- Update the status pills and the three tiles.
- Write risks and changes, then review with the team.
Getting Honest Progress Percentages
People tend to say 90 percent for weeks. Ask instead what is left to do, and estimate the remaining hours. Then percentage complete is hours done divided by hours done plus hours remaining. This question makes hidden work visible and gives you a better percentage than a gut feeling.
Using the Tracker With Timesheets
The tracker works best fed by project timesheets, such as the timesheet with project and task codes in this collection. Staff log hours against codes each day, and the manager totals the codes weekly. The tracker then turns those totals into a view of the whole project.
When Estimates Change
Sometimes the original estimate was wrong, or the scope has grown. Do not overwrite it silently. Add a note that says estimate revised from 40 to 50 hours on a date, with the reason, and keep a copy of the first version. Honest records of change protect everyone and improve future estimates.
Editing Tasks and Bars
All text is editable, and the table is a real Table object. Add rows for more tasks, retype owners and estimates, and recolour the status pills. Move or resize the progress bars after you add rows, since they are separate shapes. Retype the totals row and tiles as well.
Project Manager Signature and Printing
A single line for the project manager sits at the foot. Print on US Letter turned sideways, scaled to 100 percent. In black and white, the violet bars become dark grey and the green bars a lighter grey, so finished tasks stay distinct.
Project Tracker Questions
Can I track costs instead of hours?
Yes. Replace the estimate and actual columns with budget and spend.
Does the difference calculate itself?
No. It is typed text. Recalculate it whenever progress or hours change.
Is it suitable for non-software projects?
Yes. Change the tasks to any work breakdown, from events to building jobs.