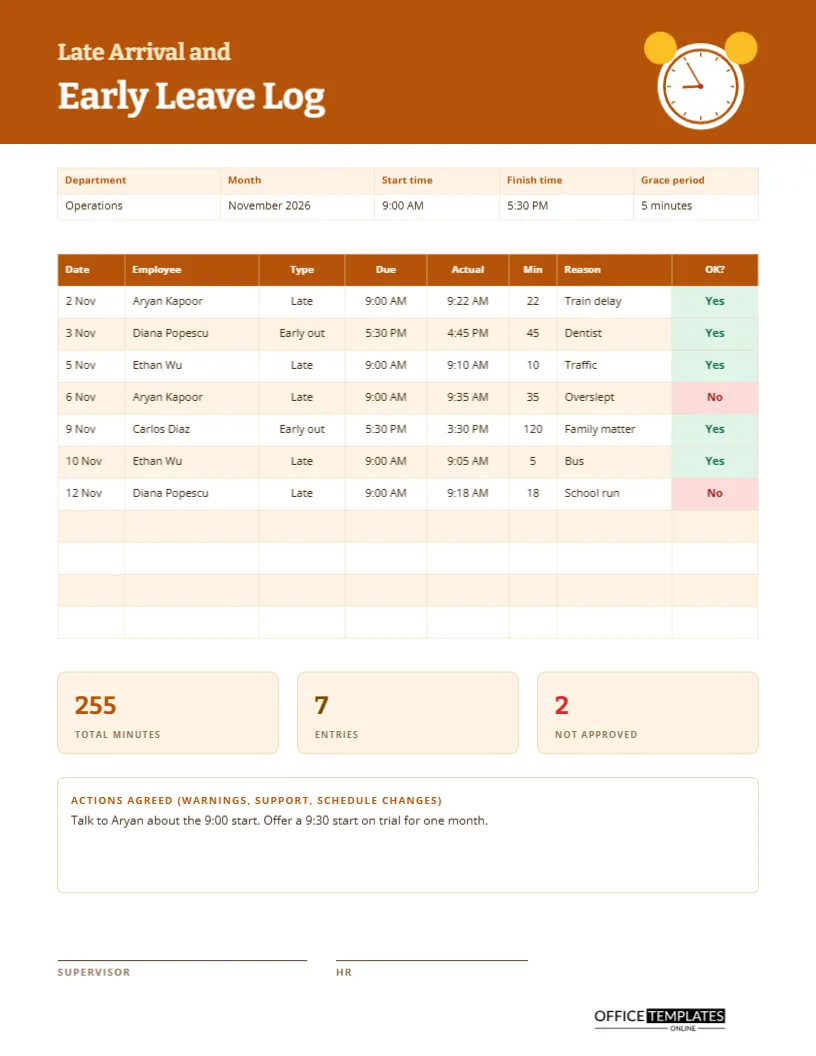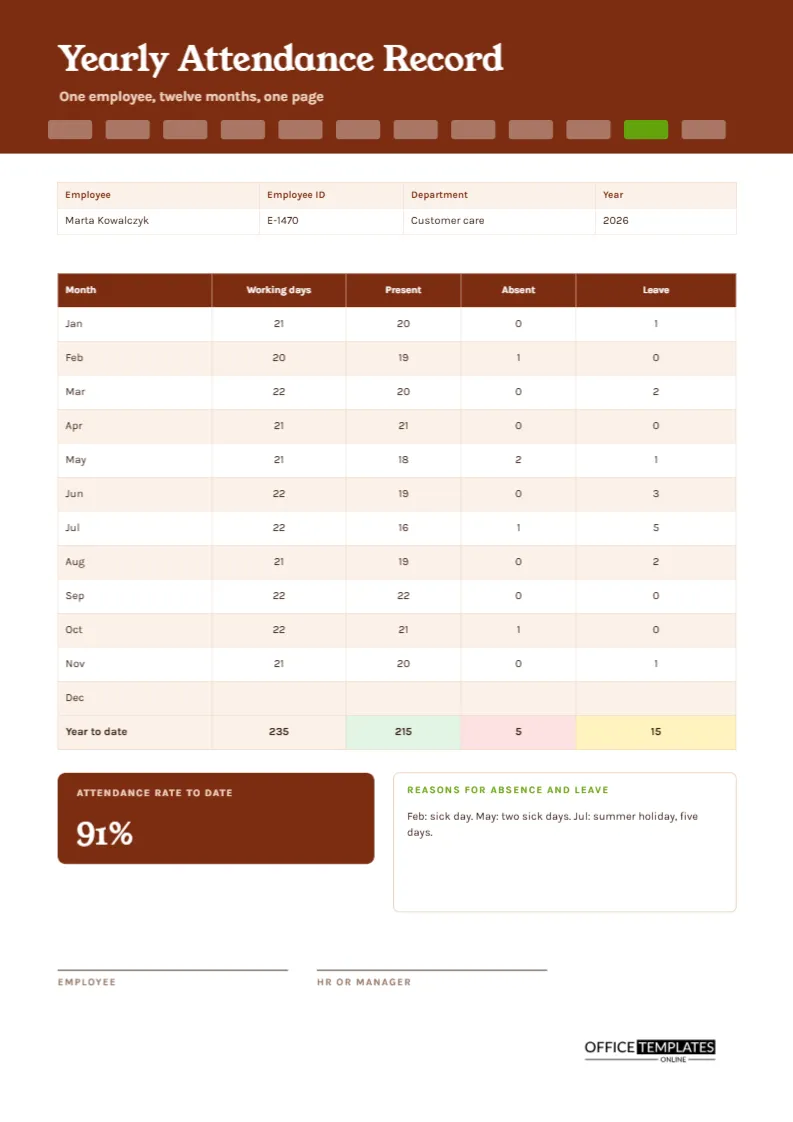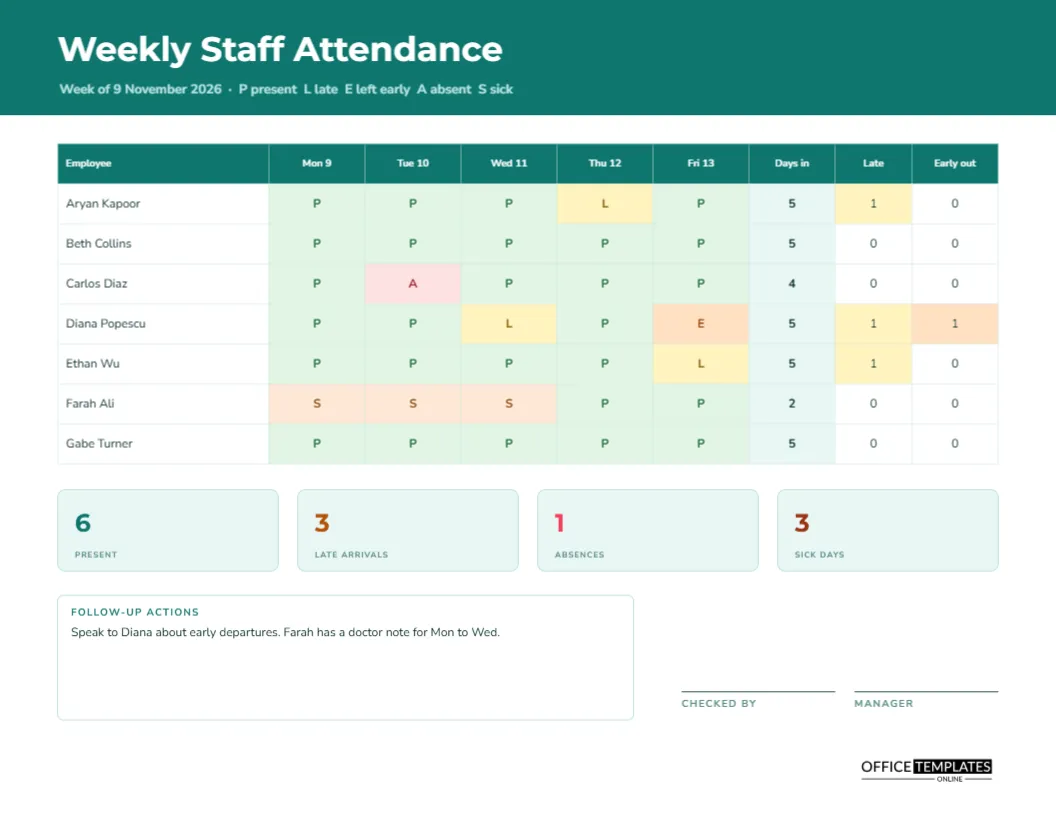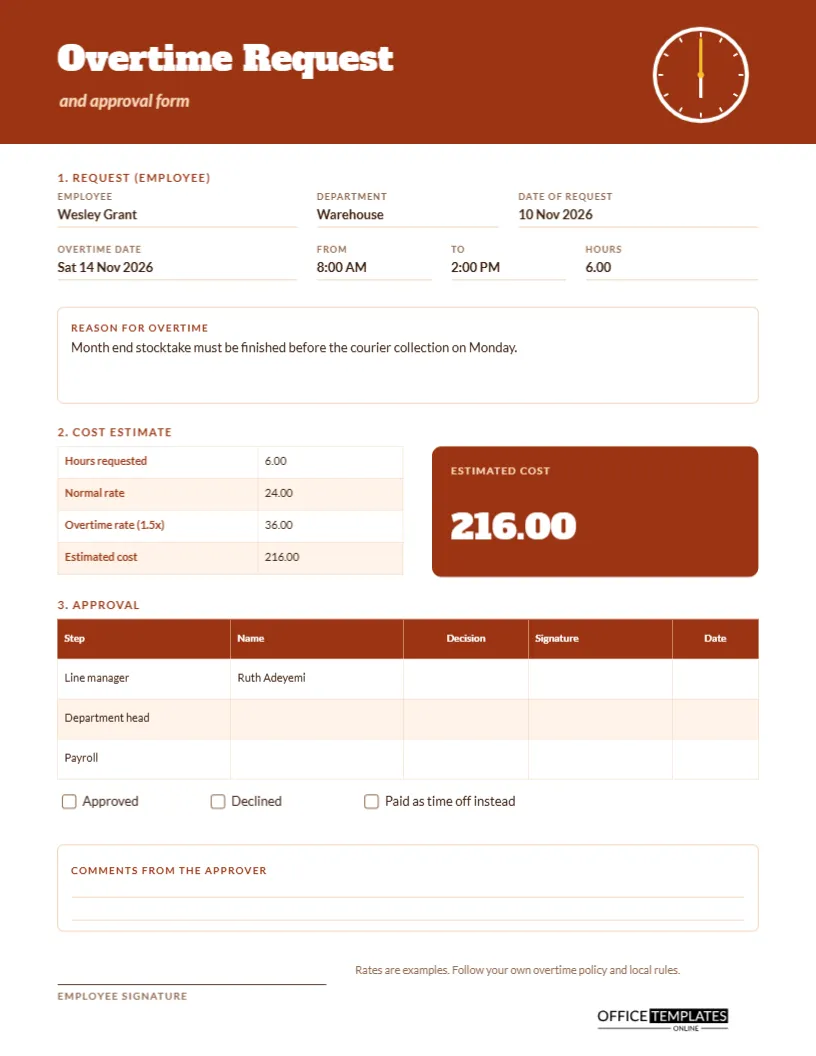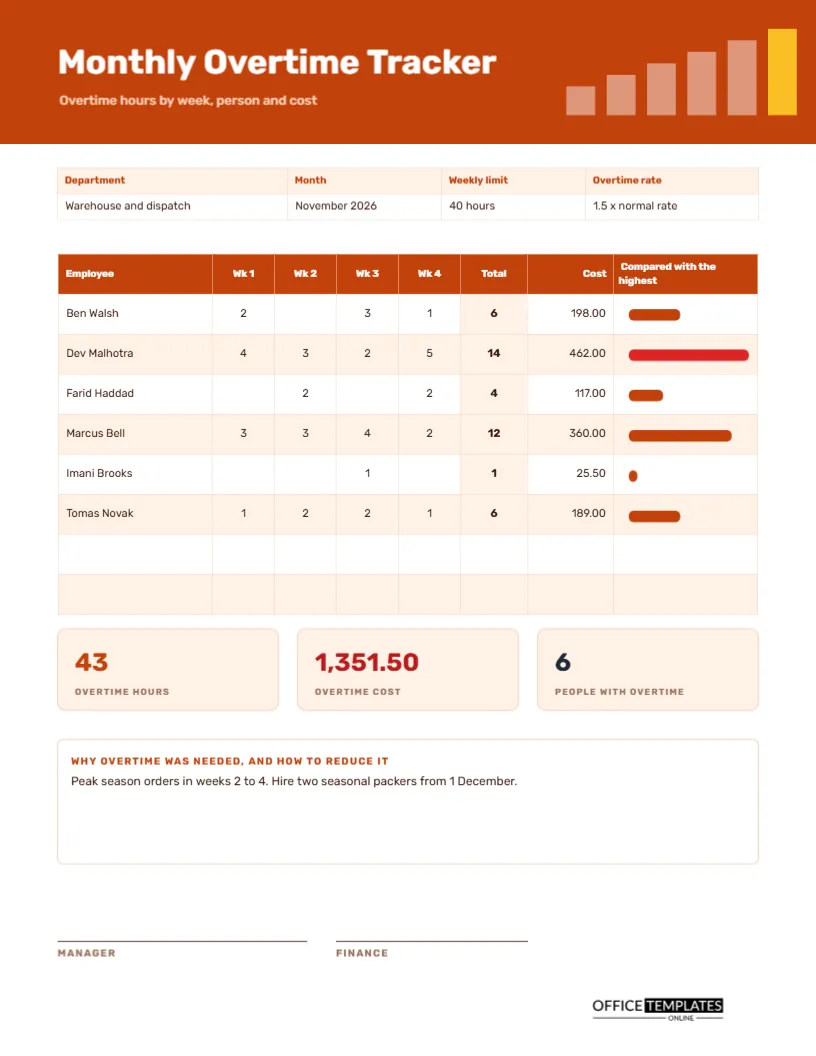
Overtime creeps. A few extra hours here, a Saturday there, and by the end of the month the payroll bill is higher than anyone expected. A monthly tracker brings it into the open. It shows how many overtime hours each person worked in each week, what they cost, who carried the most, and why it was needed. This US Letter page also draws a bar beside each name, so the heaviest load is clear without reading numbers.
Rust Orange Header With Rising Bars
The header is a strong rust orange. At its right edge, six white bars of increasing height rise across the band, the last one in gold. The picture suggests growth and rising costs. The title Monthly Overtime Tracker is set in heavy Rubik, with a subtitle about overtime hours by week, person, and cost. The look is bold and urgent, matching its purpose.
Department, Month, Weekly Limit and Overtime Rate
The strip beneath records the department (Warehouse and Dispatch), the month (November 2026), the weekly limit (40 hours), and the overtime rate (1.5 times the normal rate). The weekly limit defines what counts as overtime, and the rate defines what it costs. Both appear on the page so that the arithmetic is explained, not assumed.
Weeks Across, People Down
| Employee | Week 1 | Week 2 | Week 3 | Week 4 | Total | Cost |
|---|---|---|---|---|---|---|
| Ben Walsh | 2 | 0 | 3 | 1 | 6 | 198.00 |
| Dev Malhotra | 4 | 3 | 2 | 5 | 14 | 462.00 |
| Farid Haddad | 0 | 2 | 0 | 2 | 4 | 117.00 |
| Marcus Bell | 3 | 3 | 4 | 2 | 12 | 360.00 |
| Imani Brooks | 0 | 0 | 1 | 0 | 1 | 25.50 |
| Tomas Novak | 1 | 2 | 2 | 1 | 6 | 189.00 |
Zero weeks are left blank on the real page.
How the Cost Column Is Worked Out
Cost equals total overtime hours times the person’s normal hourly rate times 1.5. Dev Malhotra’s normal rate is 22.00, so overtime costs 33.00 an hour, and his 14 hours cost 462.00. Rates are examples, not a guide to what you should pay. Write your own rates and multiplier, and retype the numbers to match.
The Comparison Bars
The last column, Compared with the highest, contains a thin bar for each person. The longest bar, for the person with the most overtime, is red. Others are orange and scaled in proportion to the highest. A glance down the column shows who carries the load. If one bar is much longer than the rest, ask whether the work is unevenly shared.
Overtime Hours, Overtime Cost and People With Overtime Tiles
Under the table, tiles report overtime hours (43), overtime cost (1,351.50) and people with overtime (6). Together they tell the story of the month. Compare them with last month and with your budget. If the cost has doubled, the next question is why, and the notes box below is the place to answer it.
Why Overtime Was Needed, and How to Reduce It
A large notes box invites the manager to explain. The sample reads: peak season orders in weeks 2 to 4; hire two seasonal packers from 1 December. This turns the tracker from a record into a plan. The best use of overtime data is to decide whether a pattern should be solved with hiring, scheduling, process change, or acceptance.
Filling in the Tracker Each Week
- Write the department, month, weekly limit, and rate.
- At the end of each week, copy each person’s overtime hours into the right column.
- At month end, add each row and multiply by the rate.
- Draw each person’s bar in proportion to the highest total.
- Fill the three tiles.
- Write the reasons and the plan, then sign.
Distinguishing Planned From Unplanned Overtime
Planned overtime, such as a scheduled stocktake, is a choice. Unplanned overtime, such as covering sickness, is a symptom. Mark the difference in the notes or use two colours in the cells. If most of your overtime is unplanned, the issue may be absence cover or poor forecasting. If it is planned, check that it is the cheapest way to meet the need.
Fairness and Wellbeing
Look at who works the extra hours. If the same person is always asked, they may be exhausted, and others may be missing out on pay they want. Rotate fairly, check that rest rules are followed, and talk to staff. The tracker highlights concentrations, but it takes a conversation to learn whether people are happy with them.
Comparing Month to Month
Keep each month’s page and place them side by side. Seasonal patterns appear. If November is always heavy, you can hire early and avoid the premium. If one department’s cost keeps rising, you have an argument for budget or staffing changes backed by real numbers from your own records.
Editing People, Weeks and Rates
The table is a real Table object, so add rows for more people or a fifth week. The comparison bars are shapes: resize them by dragging their right edge. Retype totals, costs, and tiles after changes, as they are plain text. Change the weekly limit if your contract uses a different figure.
Manager and Finance Signatures
The manager and finance sign at the foot of the page. Print on US Letter. The orange header prints well in colour, and the table and bars are clear in black and white, with the longest bar shown darkest.
Setting a Target to Reduce Overtime
Pick a realistic target for next month, such as ten percent fewer overtime hours, and write it in the notes box. Review at the end of the month to see whether the actions worked. A target gives the tracker a purpose, and a record of results shows which measures are worth repeating.
Overtime Approval and Fair Pay Checks
Check that every overtime hour on the page was approved and paid at the correct rate. A missing approval is an invitation to dispute, and an unpaid hour is a breach of trust. Compare the totals with the payroll summary for the same period and resolve differences before anyone notices.
Overtime Tracker Questions
Can I track by day instead of by week?
Yes. Replace the week columns with days for a shorter period.
What about time off instead of pay?
Use the compensatory time off tracker for hours that are taken as time off.
Is 1.5 times the right rate?
That depends on your contract and local rules. The sample is an example.