Report cards arrive a few times a year. Marks arrive every week. A grade tracker closes the gap between the two, so there are no surprises when the report comes home. Writing each mark down as it is returned takes seconds; spotting a slipping subject two months early can change a whole term.
This template is built for students who like to see the numbers. It works for middle school, high school and college, and it prints on a single A4 portrait page (210 x 297 mm).
Real Graph Paper, Real Numbers
The entire page is printed as light blue graph paper, and the squares are exactly one centimetre wide when the sheet is printed at actual size. That makes the page feel like a maths notebook and gives you a genuine grid for sketching your own graphs.
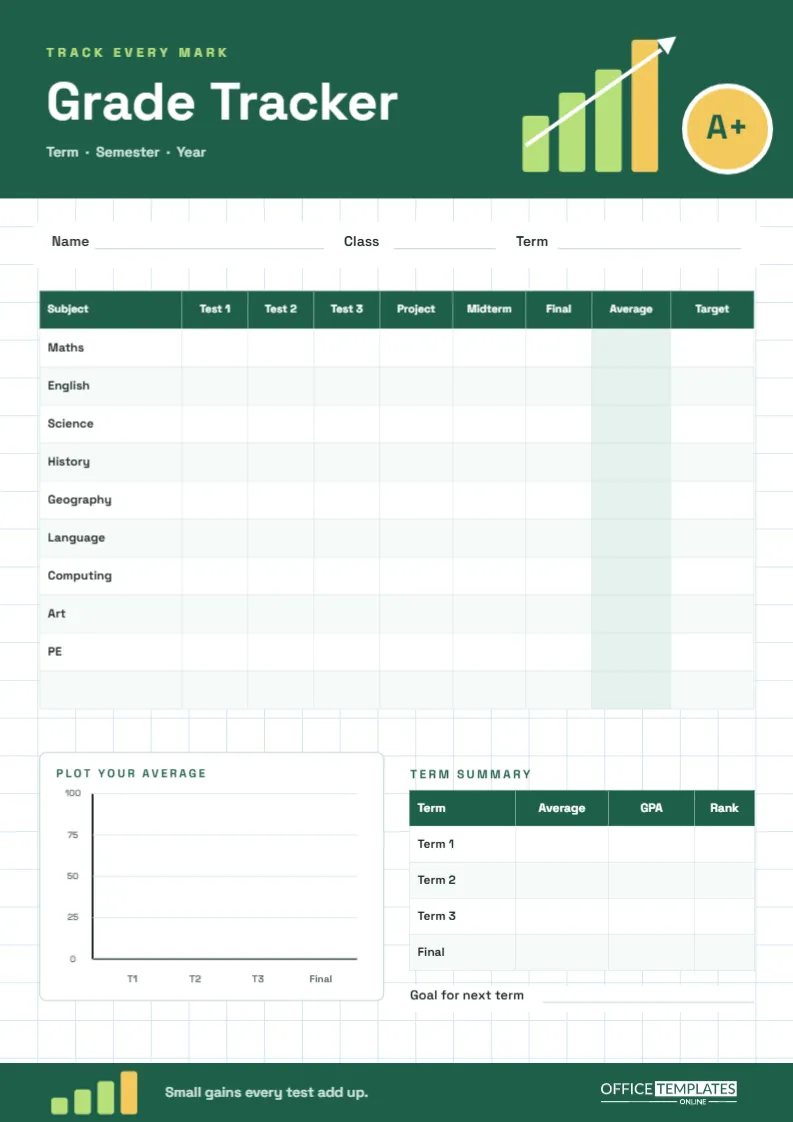
Across the top is a deep green header. On the left, a lime Track every mark label sits above the title Grade Tracker in bold, geometric Space Grotesk white type, with Term · Semester · Year beneath. On the right, four bars climb in lime and gold with a white arrow shooting upward past them, next to a gold badge with a white ring that reads A+. A matching green band closes the bottom of the page, carrying a smaller set of rising bars, the line Small gains every test add up and our logo in white.
The Marks Table
Under a white strip with Name, Class and Term lines is the main table. Rows list ten subjects: Maths, English, Science, History, Geography, Language, Computing, Art, PE and one blank row for anything else. Columns follow the shape of a typical school term:
- Test 1, Test 2, Test 3 for unit tests and quizzes
- Project for coursework or a practical
- Midterm and Final for the big exams
- Average, shaded in pale green so it stands out
- Target, the mark you are aiming for
Working Out Your Average: Two Worked Examples
The Average column is where the tracker earns its keep. There are two common ways to calculate it, and it helps to know which one your school uses.
Simple average
Add the marks and divide by how many there are. If your Science marks are 72, 80, 68, 85, 74, and 81, the total is 460, and 460 divided by 6 is 76.7. Write 77 in the Average cell.
Weighted average
Many schools count exams more heavily than tests. Suppose tests count for 30%, the project 20%, the midterm 20%, and the final 30%. With a test average of 73, a project of 85, a midterm of 74, and a final of 81, the calculation is:
| Component | Mark | Weight | Contribution |
|---|---|---|---|
| Tests (average) | 73 | 30% | 21.9 |
| Project | 85 | 20% | 17.0 |
| Midterm | 74 | 20% | 14.8 |
| Final | 81 | 30% | 24.3 |
| Weighted average | All components | 100% | 78.0 |
Notice how the weighted result (78.0) is higher than the simple test average of 73: strong exam and project marks pull it up. The reverse also happens, which is why a single poor final can hurt more than several weak quizzes. Knowing the weights tells you where extra effort pays off most.
If you do not know your school’s weights, ask your teacher. Using the right method means the tracker predicts your report, not just approximates it.
Plot Your Average
Below the table, a white panel called Plot Your Average has a ready-drawn chart: a vertical axis from 0 to 100 and four points along the bottom for T1, T2, T3, and Final. Mark a dot for your overall average at each point and join them. A line that climbs is the most motivating thing on the page; a line that dips tells you early that something needs attention. Because the page is graph paper, you can also draw separate lines for individual subjects in different colours.
Term Summary and Next Goal
Beside the chart is a small Term Summary table with rows for Term 1, Term 2, Term 3 and Final, and columns for Average, GPA and Rank, for schools that report them. Underneath, a Goal for next term line invites one specific, realistic target, such as raising Maths from 68 to 75.
Customize It for Your School
- Double-click the marks table to open Edit Table Data. Rename subjects, rename columns (Quiz instead of Test, Lab instead of Project), or add rows.
- Change the column count in the Table panel if your term has more assessments.
- Rename GPA to Grade or Band if your school uses letters or levels rather than a grade point average.
- Recolour the green header and footer to your school colours; the graph paper stays neutral.
Printing the Graph Paper Correctly
To keep the one-centimetre squares accurate, download the PDF and print on A4 with scaling set to Actual size or 100%. The header and footer bands are the only heavy colour. Keep the tracker in the front pocket of your school folder, and add marks the day they are returned, while the feedback is still fresh.
Reading the Numbers Wisely
A tracker should motivate, not worry you. One low mark is information, not a verdict; look for patterns across three or four assessments instead. Compare your Average column with the Target column once a month and pick just one subject to focus on. And remember to notice the subjects that are quietly improving, because those are proof that effort works.
Grade Tracker FAQs
Can parents use this to follow progress?
Yes. Many families keep a copy on the fridge and add marks together each week, which makes report-card conversations calmer.
Does it work with letter grades?
It does. Write letters in the cells, and convert them to numbers only when you want an average.
Can I track a whole year?
Use one page per term, or add pages with Add Page. The Term Summary table on the last page then holds the whole year.
Watch the Line Climb
Print the tracker, fill in the marks you already have, and set one target. Every new mark makes the picture clearer, and small gains, test by test, really do add up.