Marketing is a visual field, and marketing students are expected to present work with flair. A plain cover on a consumer research report feels like a missed opportunity. This one borrows the language of a modern agency deck: bold colour blocks, a donut chart, a megaphone, and big headline statistics. Behind the energy is a practical structure. The title states the research question, a compact table lists objective, method, sample and fieldwork dates, and the details tell your instructor who did the work.
Five Colour Tiles Above the Fold
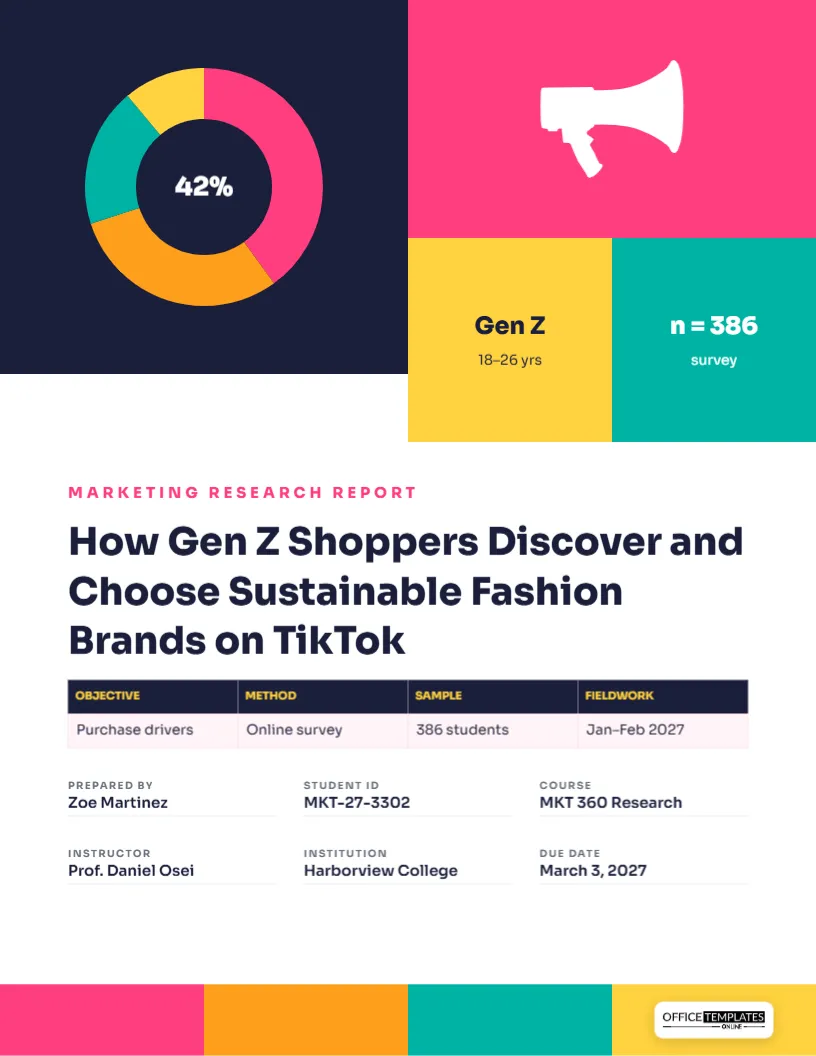
The top of the page is a grid of colour blocks. On the left, a large navy square holds a donut chart split into hot pink, orange, teal and yellow segments, with 42% in white at its centre. On the right, a hot pink block holds a white megaphone. Under the pink block, two smaller tiles sit side by side: yellow with Gen Z 18-26 yrs and teal with n = 386 survey. Below the grid, on white, a pink label reads Marketing Research Report, and the title, How Gen Z Shoppers Discover and Choose Sustainable Fashion Brands on TikTok, is set in heavy navy Sora. A four-column table follows, then six details in three columns. Four colour stripes, pink, orange, teal and yellow, run along the very bottom, with the logo on a light plate in the corner.
Headline Numbers on the Tiles
The tiles work like the opening slide of a pitch: one striking number and two quick facts about the audience. Change them to match your study. The donut’s centre figure should be your most interesting finding, for example, the share of respondents who discovered a brand on social media. The yellow tile describes the target audience, and the teal tile gives the sample size. Keep each tile to two short lines. If your study is still in progress, use the tiles for the audience, the sample target, and the channel you study.
The Study Table
The table lists Objective (Purchase drivers), Method (Online survey), Sample (386 students), and Fieldwork (Jan–Feb 2027). It is a real table: select it and use Edit Table Data to type your own entries. This is the information an instructor or client looks for first in any research report, so keeping it on the cover saves them hunting. Use short phrases rather than sentences.
Marketing Research Methods at a Glance
| Method | Best for | Typical sample |
|---|---|---|
| Online survey | Measuring attitudes and behaviour across many people | 150-500 respondents |
| Focus groups | Exploring motivations and language | 3-5 groups of 6-8 people |
| In-depth interviews | Understanding decision journeys | 10-20 interviews |
| Social listening | Tracking brand conversations | Thousands of posts |
| A/B testing | Comparing ads, emails or pages | Hundreds to thousands of users |
| Conjoint analysis | Valuing product features and price | 200+ respondents |
Titling a Consumer Study
Marketing research titles should name the audience, the behaviour and the context. How Gen Z Shoppers Discover and Choose Sustainable Fashion Brands on TikTok covers all three: who (Gen Z shoppers), what (discover and choose sustainable brands), and where (TikTok). Starting with How or Why signals an exploratory study; The Effect of… signals an experiment. Avoid brand-name-only titles like Nike Report, which hide your question.
Who Prepared the Research, and for Whom
The details are Prepared by (Zoe Martinez), Student ID (MKT-27-3302), Course (MKT 360 Research), Instructor (Prof. Daniel Osei), Institution (Harborview College) and Due date (March 3, 2027). Click to edit any value. For a client project, rename Instructor to Client and Student ID to Agency or Team.
Changing the Palette to a Brand
Bright pink, orange, teal and yellow suit youth and lifestyle topics. If your report studies a particular brand or category, use a palette that suits it: greens and browns for food and sustainability, blues for finance and tech, black, gold and cream for luxury. Change each tile, the donut segments, and the footer stripes. The donut is a group of four segments; ungroup it to recolour segments individually, or to adjust their sizes to reflect a real split from your data. The megaphone is an editable vector you can recolour from its swatches.
From Findings to Recommendations
Marketing instructors look for recommendations that follow from evidence. Plan your report so each finding leads to an action: 68% discover brands through creators, so allocate budget to creator partnerships before paid ads. Many students use the So what? test: after every chart, write one sentence on what a marketer should do differently. Your cover’s headline number should be the finding that drives your most important recommendation.
Survey Ethics and Data Quality
Even classroom surveys involve real people. Tell respondents how their answers will be used, keep responses anonymous, and do not collect personal data you do not need. Check data quality before analysing: remove duplicate or speeding responses, and report how many you removed. If you used a convenience sample of classmates, say so, and avoid claiming your results represent all Gen Z shoppers.
Using the Cover in a Pitch
Marketing courses often end with a pitch to a panel or a real client. Download the cover as a PNG and use it as your title slide; the colour blocks are designed to read from the back of a room. Keep the same colours in your charts throughout the deck for a consistent identity.
Printing Bright Colour Blocks
The page is US Letter, 8.5 x 11 inches. Bright solid colours print most vividly on a laser printer or on coated paper at a print shop. Inkjets on plain paper may make the pink look slightly dull. Download as a PDF with bleed and crop marks for edge-to-edge printing at a shop.
Marketing Report Cover FAQ
Can I use a real brand’s logo?
For a class report about that brand, a small logo for identification is usually acceptable. Do not imply the brand sponsored your work.
Is this suitable for an advertising campaign plan?
Yes. Change the label to Campaign Plan and use the tiles for budget, audience, and channels.
Can I show more than one statistic in the donut?
Keep the centre to one number for impact. Show the full breakdown inside the report.