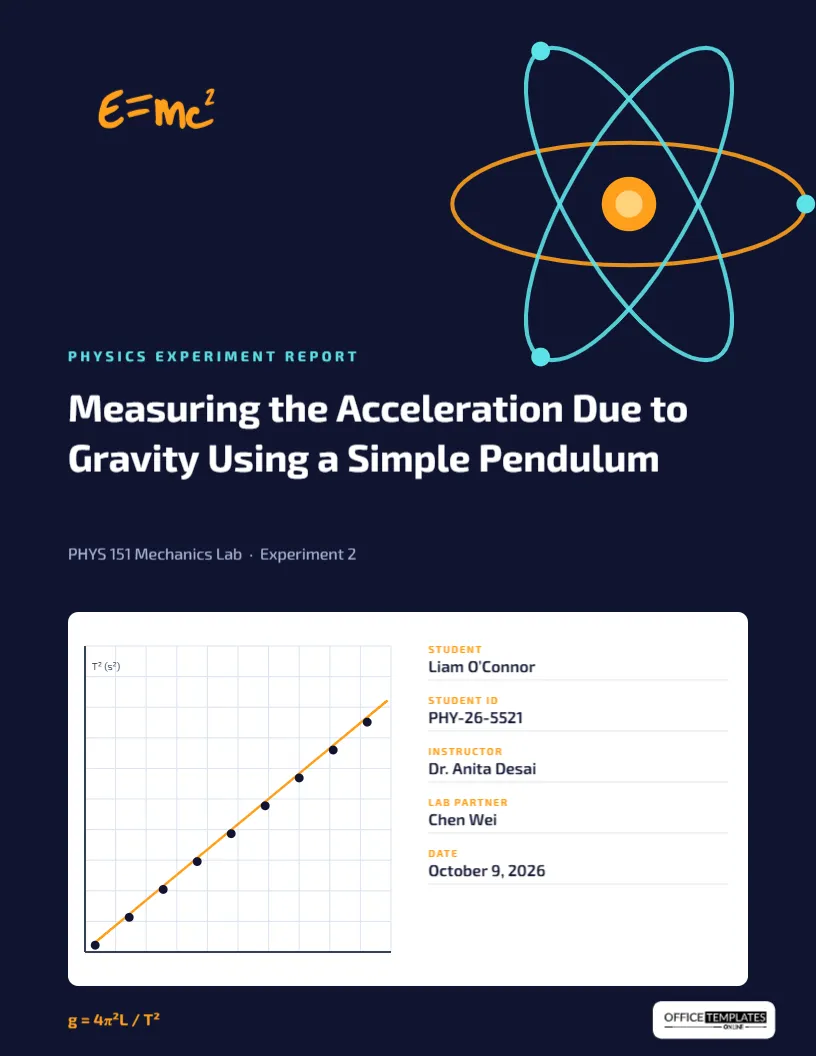
Physics labs are about turning measurements into a straight line and a number with an uncertainty. This cover celebrates exactly that. The bottom half is a sheet of graph paper with data points and a best-fit line, the kind of plot you will draw for half the experiments in a mechanics course. The top half is pure physics atmosphere: a deep midnight background, an atom with three glowing orbits and the most famous equation in science. It is designed for university and college physics labs, but advanced high school students will find it just as useful.
Midnight Blue, Orbits and a Plot
The background is a very dark navy, almost black. In the upper right, three elliptical orbits, one orange and two cyan, cross around an orange nucleus, with small cyan electrons on the paths. In the top left, an orange E=mc² mark sits like a logo. The section label Physics Experiment Report appears in cyan above the white title, Measuring the Acceleration Due to Gravity Using a Simple Pendulum, set in Exo 2, a geometric typeface with a slightly futuristic feel. A grey line gives the course and experiment: PHYS 151 Mechanics Lab · Experiment 2. The lower half holds a white panel: on the left, a small graph with T² against L and a plotted line; on the right, five lab details. The bottom edge carries the formula g = 4?²L / T² in orange and the logo on a light plate.
Your Lab Details on the White Panel
The right side of the white panel lists five fields one above another: Student (Liam O’Connor), Student ID (PHY-26-5521), Instructor (Dr. Anita Desai), Lab partner (Chen Wei), and Date (October 9, 2026). Click each value to edit it. If you need a field for your lab section, change Lab partner to Section and list your partner elsewhere, or reduce the size of the values slightly and add a sixth line.
Match the Graph to Your Own Experiment
The plotted graph is a group of grid lines, axes, data points, and a best-fit line. It shows the classic pendulum result: T² is proportional to L. For other experiments, the shape you expect is often also a straight line once you choose the right axes, so the graph can stay as it is and you only need to change the axis labels. Ungroup it to edit the labels T² (s²) and L (m).
| Experiment | Y-axis | X-axis | Formula for the footer |
|---|---|---|---|
| Simple pendulum | T² (s²) | L (m) | g = 4?²L / T² |
| Hooke’s law | F (N) | x (m) | F = kx |
| Ohm’s law | V (V) | I (A) | V = IR |
| Free fall | d (m) | t² (s²) | d = ½gt² |
| Newton’s second law | a (m/s²) | F (N) | a = F/m |
| Snell’s law | sin ?? | sin ?? | n? sin ?? = n? sin ?? |
Why Linearising Matters in Physics Labs
Most introductory physics labs ask you to rearrange an equation so the relationship becomes linear, then read a physical constant from the slope. For the pendulum, T = 2??(L/g) becomes T² = (4?²/g)L, so the slope of T² against L is 4?²/g. That is why the cover graph plots T² rather than T. Your report should explain this step in the analysis section, show the slope with its uncertainty, and compare your value of g with the accepted 9.81 m/s². The cover simply hints at the method. A reader who sees T² on the vertical axis already knows you understood the trick, and a reader who does not will find the explanation in your analysis.
Editing the Atom and Colours
The atom orbits are one group, which makes it easy to move or scale. The E=mc² mark is an editable vector; select it to change its colour from the swatches. If your report is about optics, waves, or thermodynamics, you might prefer to replace the E=mc² mark with your university logo or simply delete it. You can also change the background from midnight blue to charcoal or deep purple; the cyan and orange accents work on any very dark colour.
A Short Note on Uncertainty
Graders in physics labs pay attention to uncertainty. If you add a result to the cover, for example in place of the footer formula, give it with an uncertainty and correct significant figures: g = 9.78 ± 0.05 m/s², not g = 9.7823 m/s². Better still, keep results inside the report and use the cover only to identify the work.
Printing a Dark Physics Cover
The page is US Letter, 8.5 x 11 inches. Dark full-page backgrounds use plenty of toner or ink, and most office printers leave a small white margin around the edge. For a weekly lab, submit the PDF online if your course allows it. For a formal or final report, print it on a laser printer, or use Download As PDF with bleed and crop marks for a print shop. The white graph panel prints crisply and keeps your details readable even if the dark background prints slightly unevenly.
For Teams, Courses and Grade Levels
Physics lab groups are often two or three students. Write all names in the student field or list partners on the Lab partner line. High school teachers can use this cover for AP Physics or IB Physics internal assessments: change Student ID to Candidate number for IB, and adjust the course line.
Choosing a Title for a Physics Lab
A physics lab title should name the quantity you determined and the method you used. Measuring the Acceleration Due to Gravity Using a Simple Pendulum is a good model. Others in the same spirit: Determining the Spring Constant of a Steel Spring from Static Extension, Verifying Ohm’s Law for a Carbon Resistor, Measuring the Refractive Index of Acrylic Using Snell’s Law. Avoid titles that are only the lab number or a single word such as Momentum.
Physics Cover FAQ
Can I replace the sample graph with my real plot?
You can add an image of your plot from the editor, but a cover is better kept simple. Put your real graph in the results section.
What font should the report body use?
Any clear font is fine. Many physics students write in LaTeX or a word processor with a serif body font; the cover does not need to match.
Does the cover work for an astronomy lab?
Yes. Recolour the orbits, change the course line, and replace the E=mc² mark with a planet icon from the editor’s library.